

ONLINE TRAINING
Advanced Science Figure Design & Illustration Skills
Learn how to make figures and illustrations for high impact journals using the latest graphic design tools. The courses give you the skills to create professional scientific illustrations and data visualizations that increase your publication acceptance rates using Adobe Illustrator, Affinity Designer, and Inkscape.
Take your career to the next level by adding in-demand design skills. Sign up to receive unlimited access to all advanced courses and over 400 templates for only $59 USD.
Templates have a value of over $90 and include the popular Biological Diagram and Laboratory Tool templates
2,500+
Simplified Science users
400+
Downloadable templates
Unlimited
Access to over 50 tutorial videos
Testimonials

Scientific Design Training and Tools
All of the courses and over 400 templates are included with Simplified Science Pro for $59!
SIMPLIFIED SCIENCE PRO
Introduction to Adobe Illustrator for Scientists
A comprehensive course with everything you need to know to create scientific publications, presentations, and posters in Adobe Illustrator.
- 22 lessons
- 6 hours of training video
- Includes scientific figure and color palette templates
SIMPLIFIED SCIENCE PRO
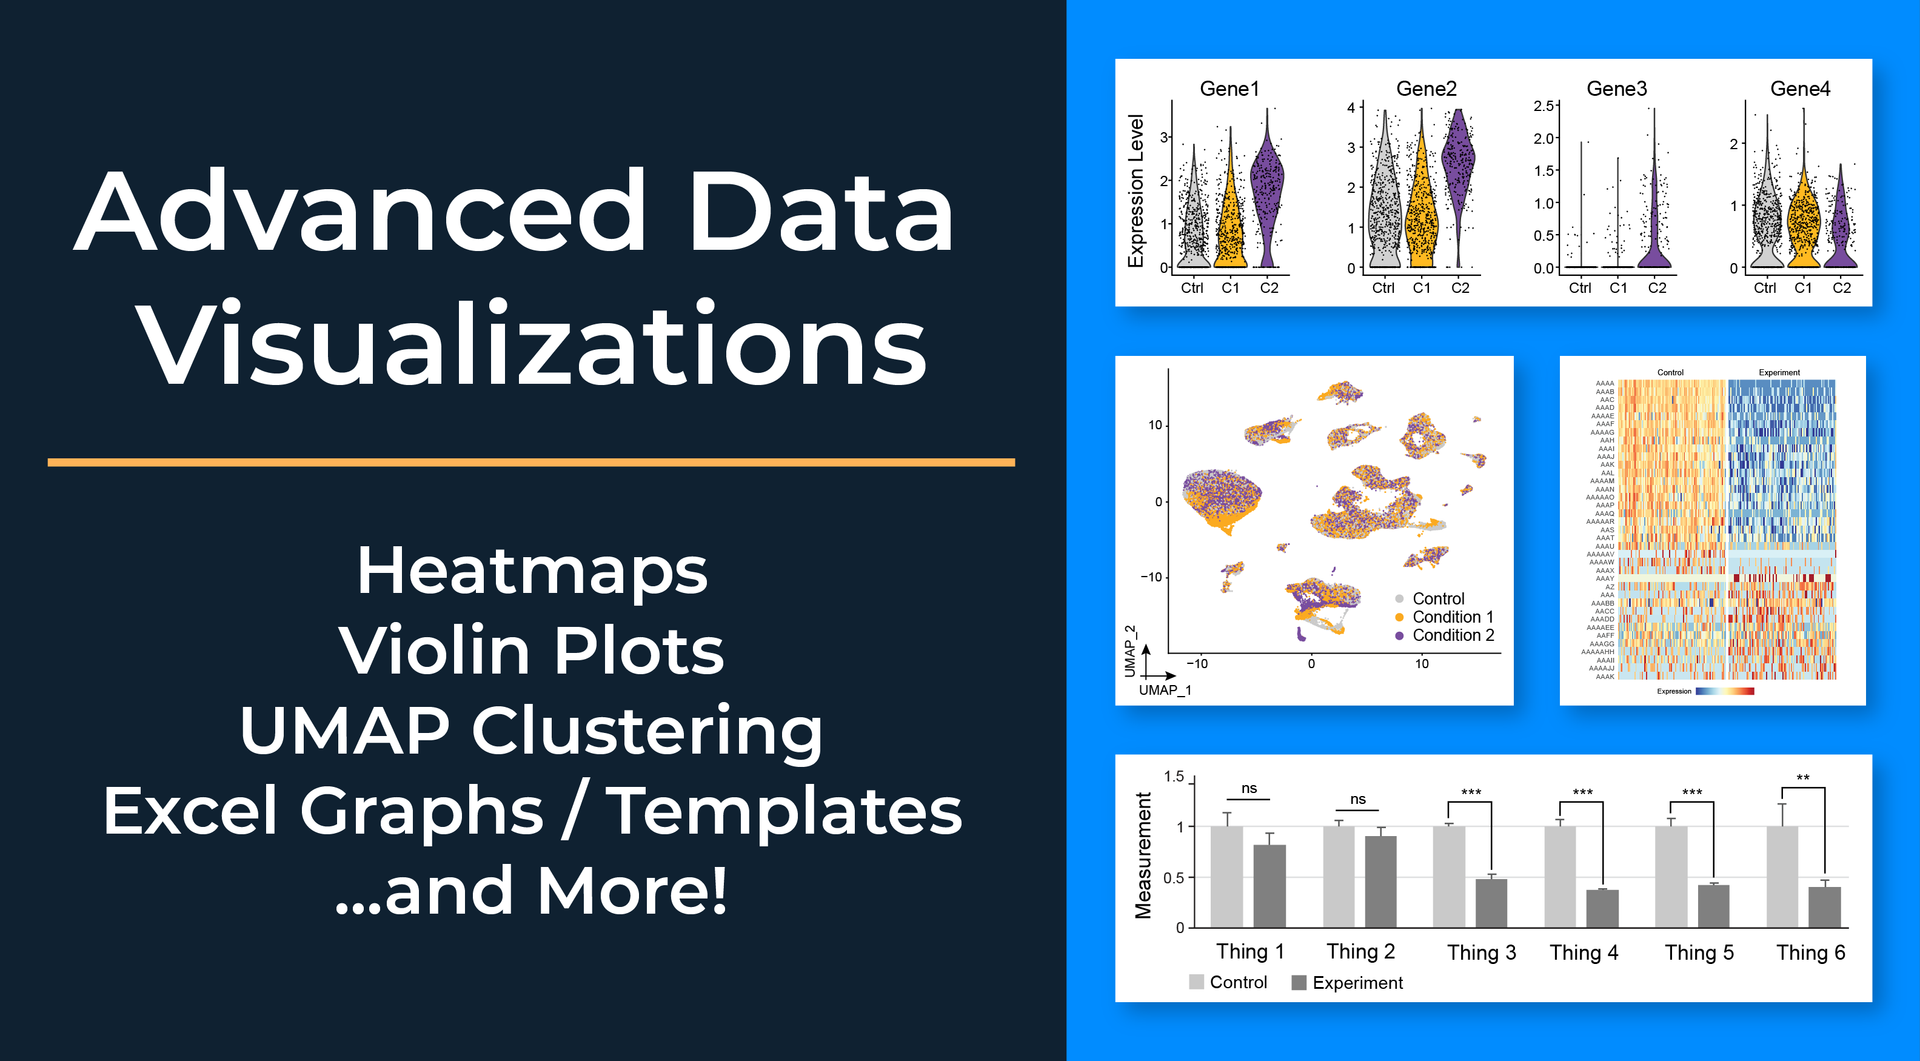
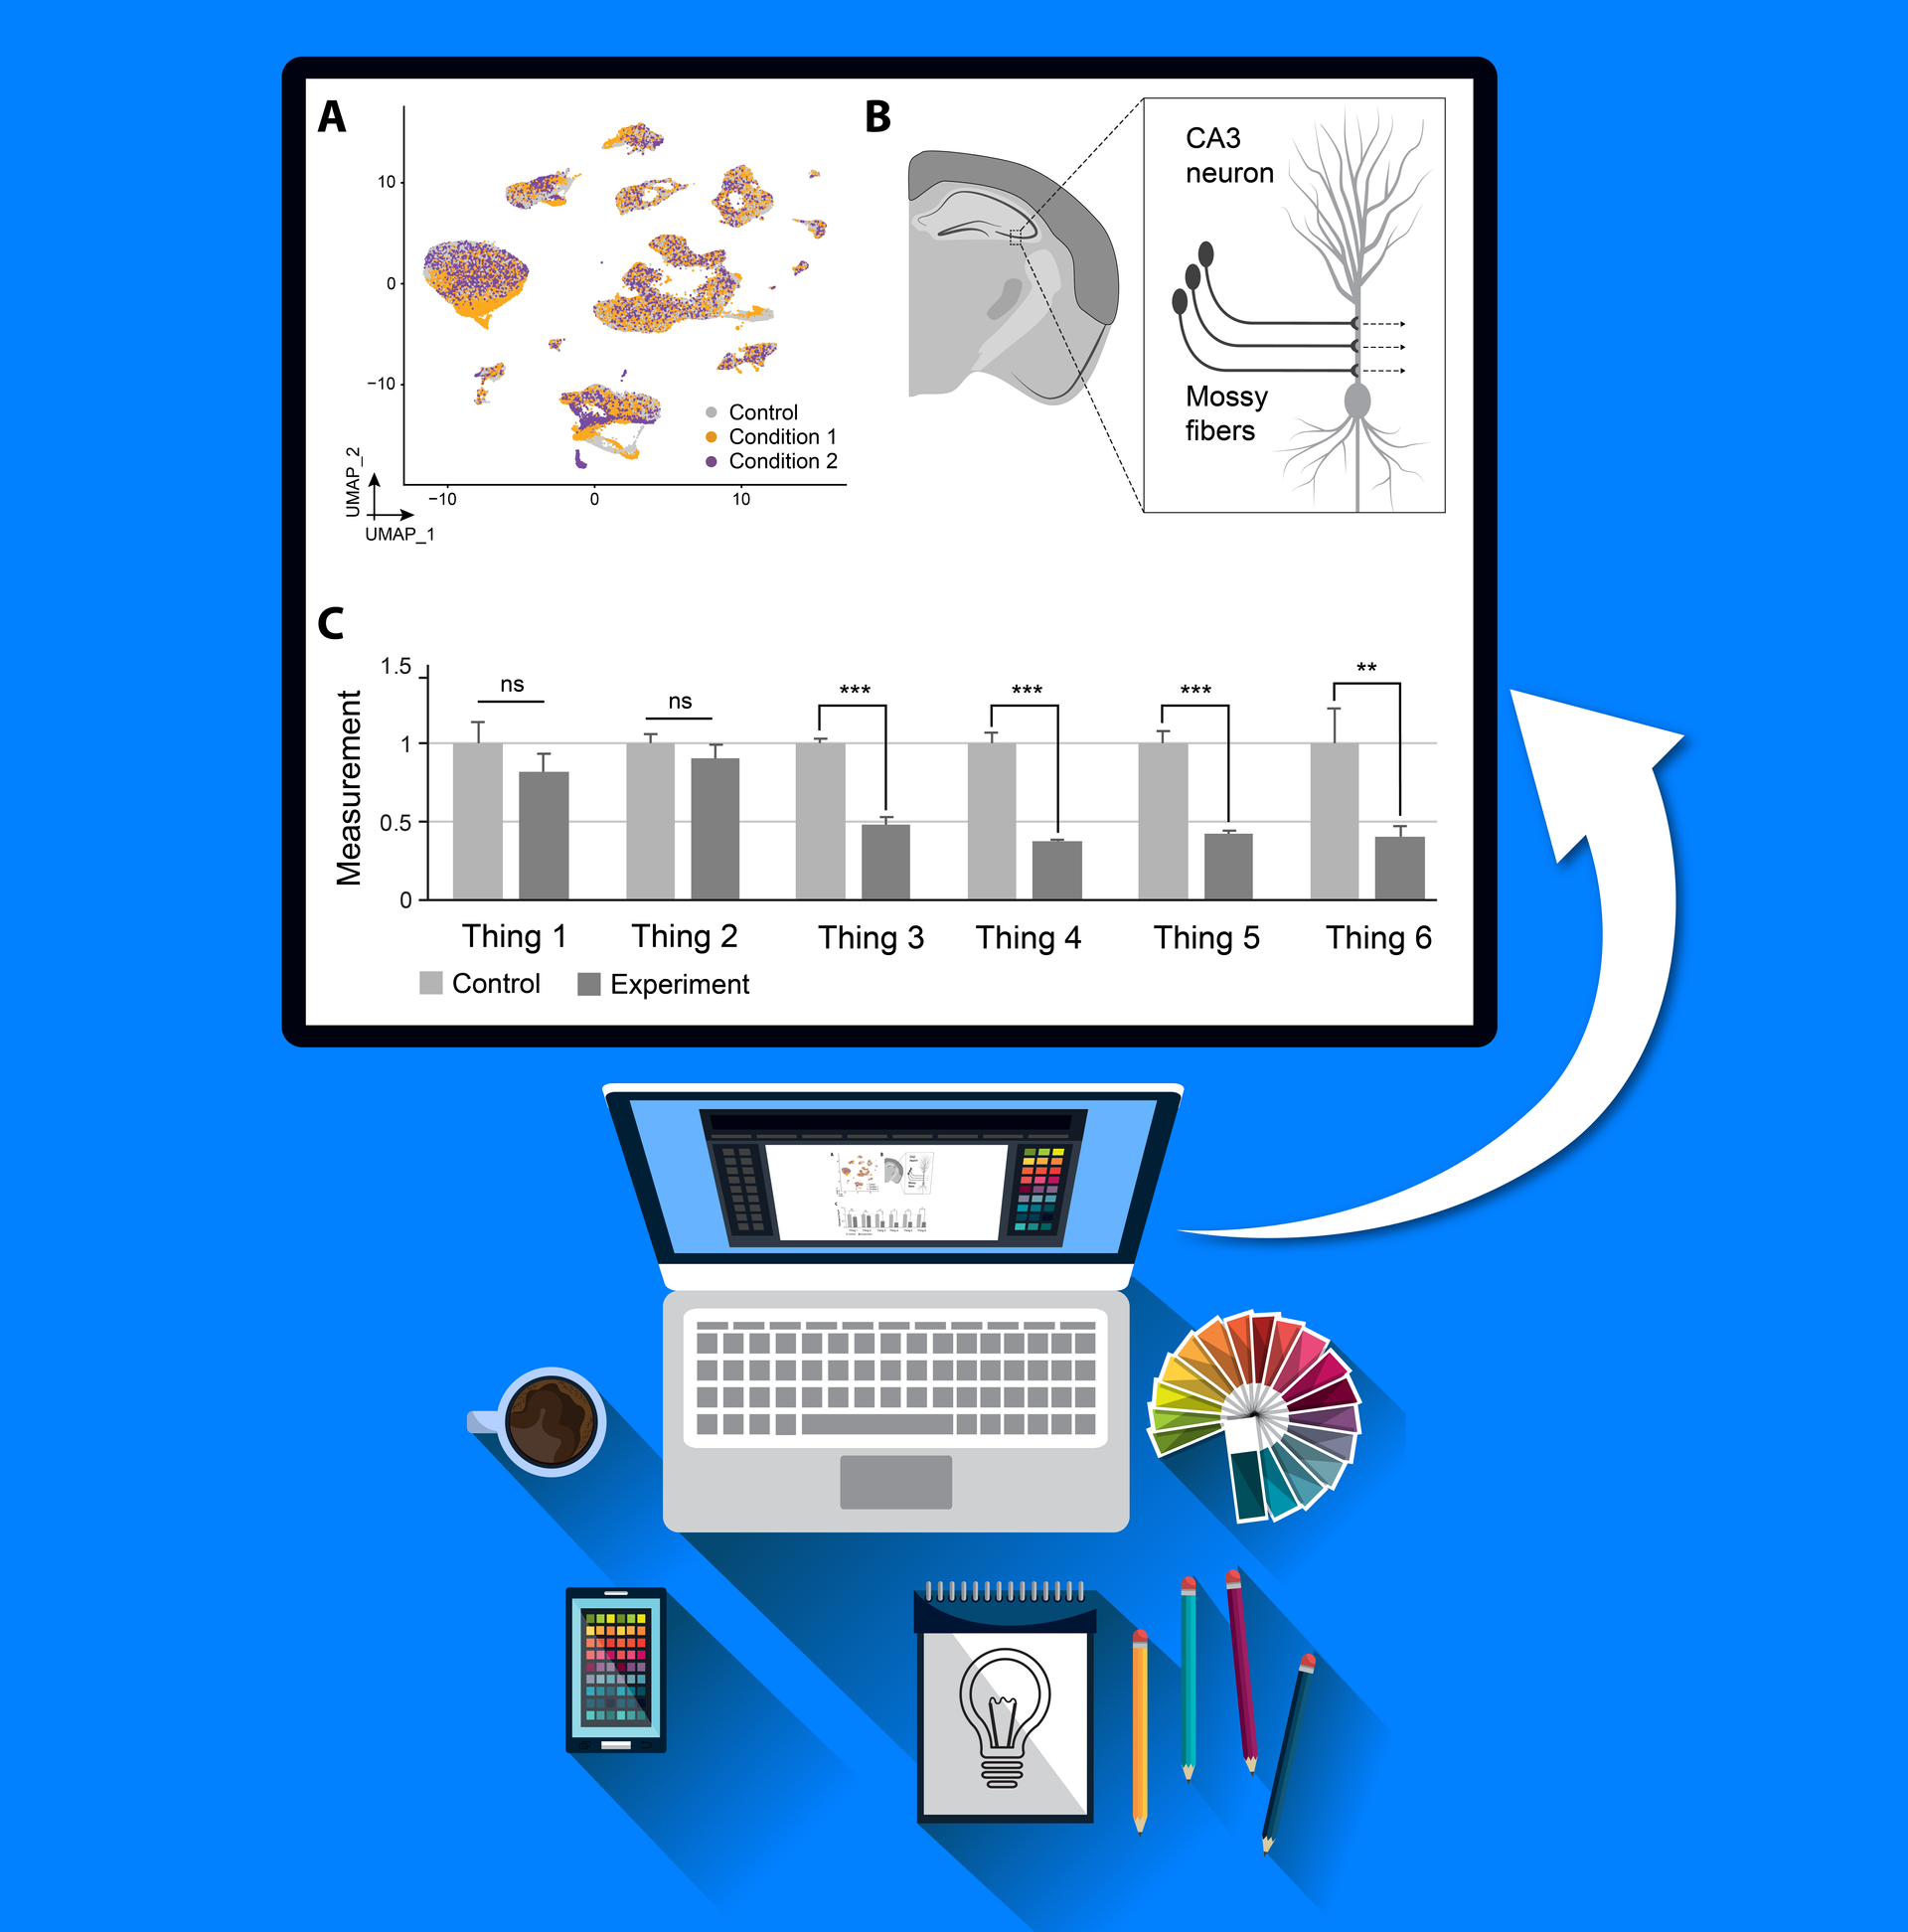
Adobe Illustrator for Advanced Data Visualizations
Learn how to transform Excel, SVG, and PDF output from different types of graphing software into professional data visualizations.
- 7 lessons
- 2.5 hours of training video
- Includes Excel graph and table templates
SIMPLIFIED SCIENCE PRO
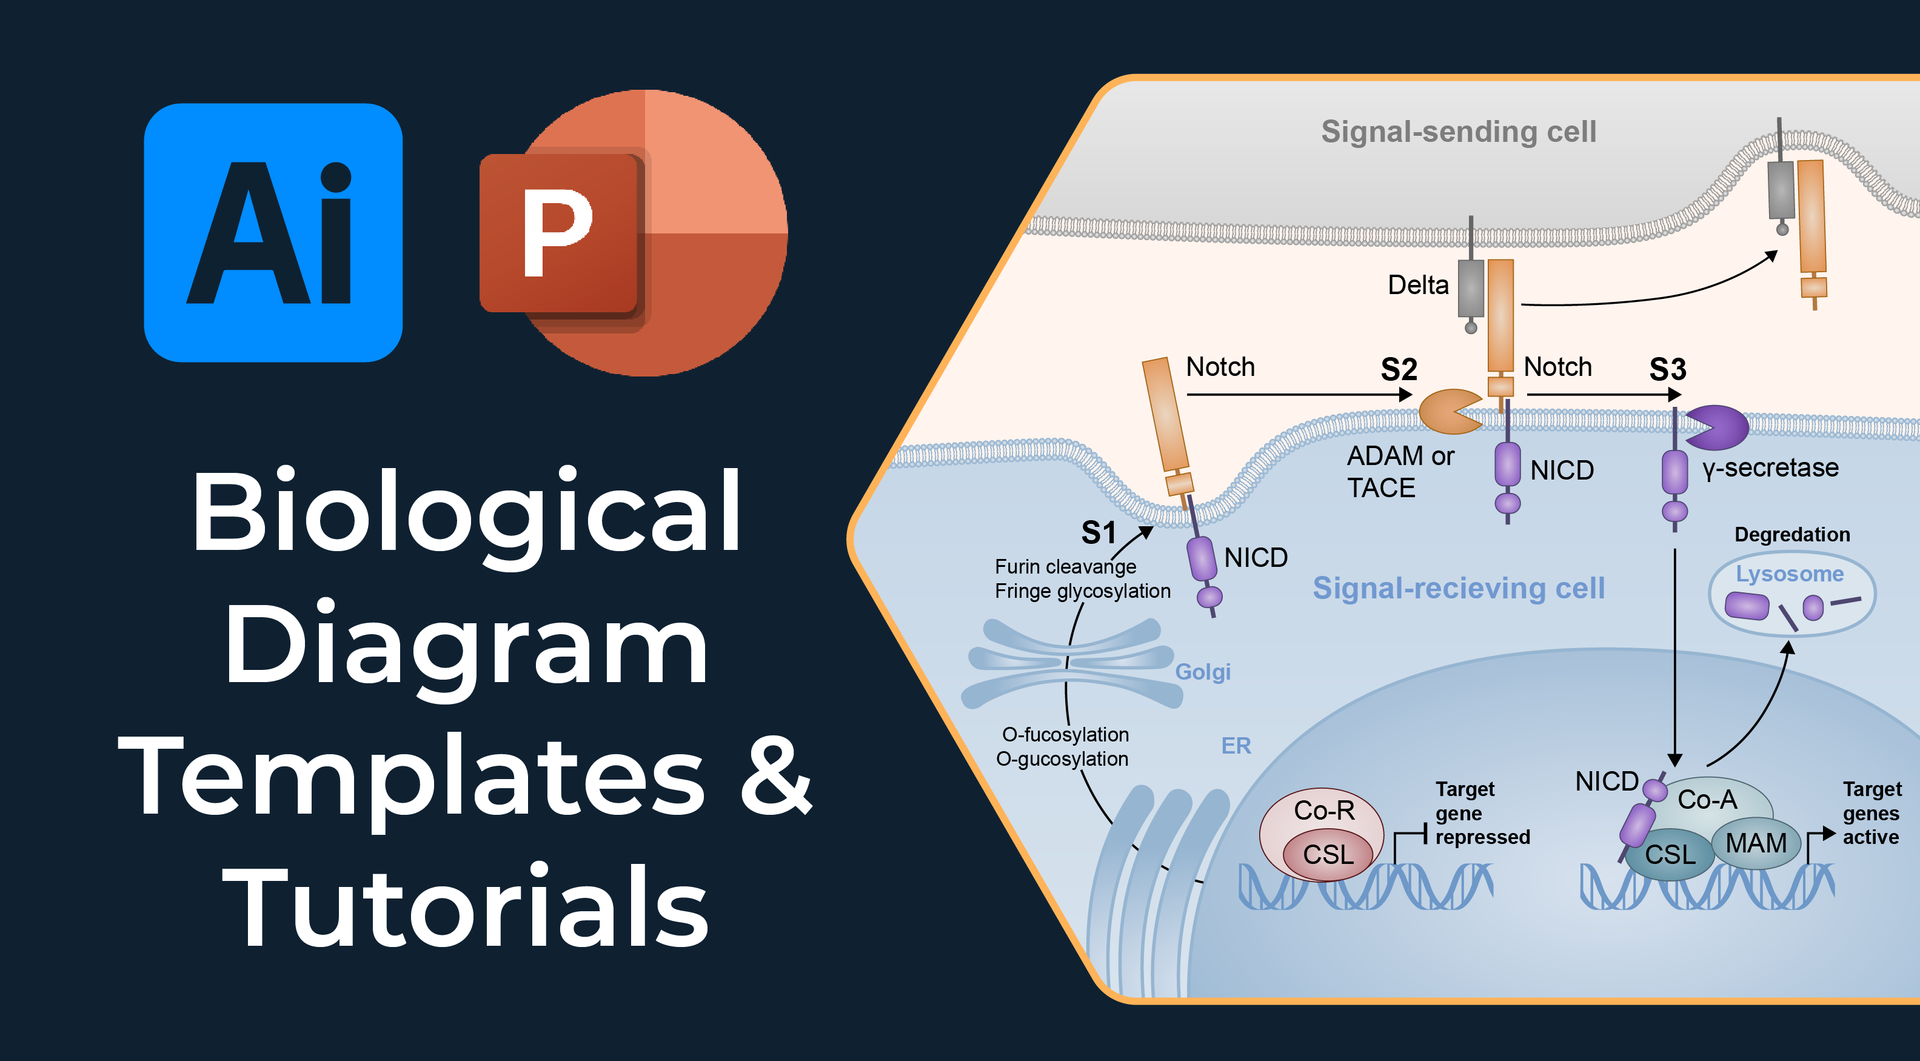
Biological Diagram Templates and Tutorials
Download over 270 customizable designs with in-depth trainings on how to use the templates to create impressive illustrations and figures.
- 10 lessons
- 3+ hours of training video
- Includes over 270 customizable vector images and template designs for Adobe Illustrator and PowerPoint
SIMPLIFIED SCIENCE PRO

Affinity for Scientists Overview
(now called Affinity by Canva)
Affinity is now free via Canva. These tutorials work the same even though Affinity has rebranded. Watch these tutorials to learn all of the basics for using Affinity's illustration and data visualization tools.
- 4 lessons
- 1.5 hours of training video
- Includes scientific figure and color palette templates (value of $2 in template store)
SIMPLIFIED SCIENCE PRO
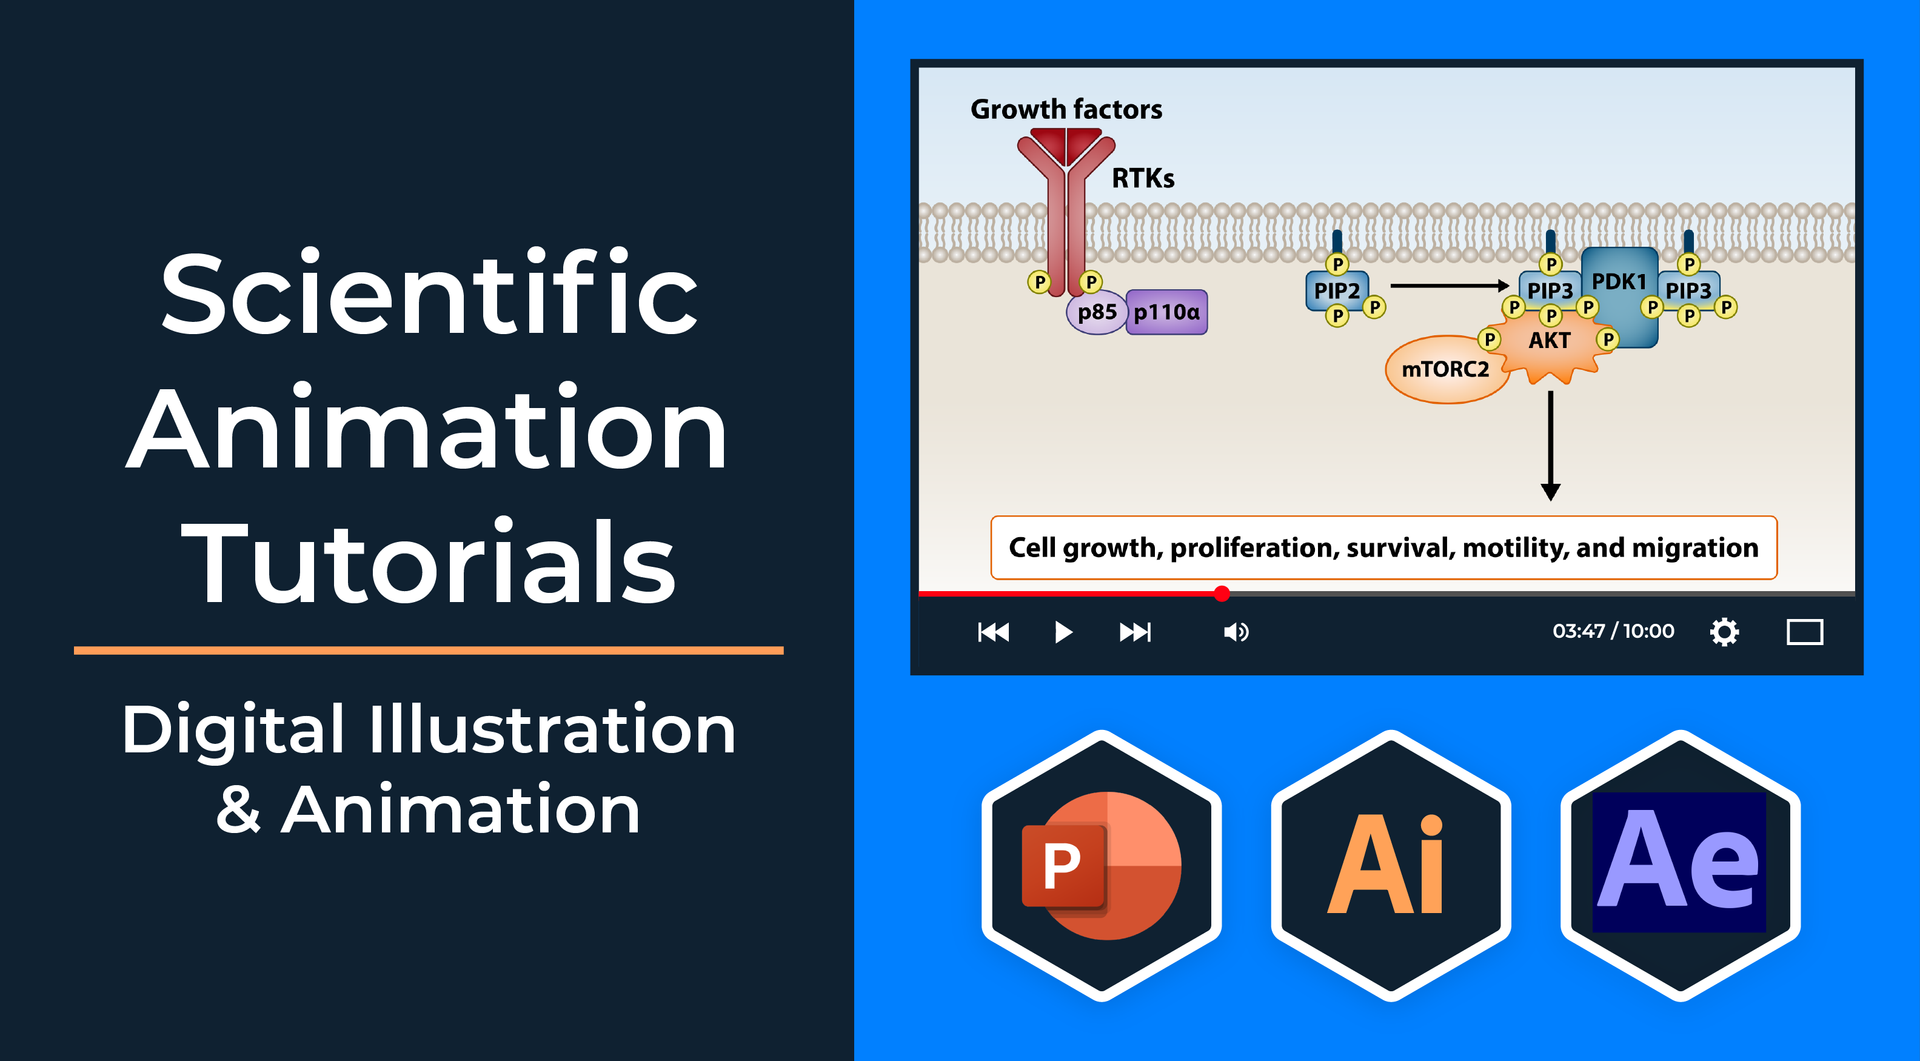
Scientific Animation Course
Learn how to make 2D animations in PowerPoint and Adobe Illustrator + After Effects. This course includes how to create a storyboard, digital drawing tutorials, and step-by-step scientific animation techniques.
- 5 lessons
- 2+ hours of training video
- Download storyboard worksheet
SIMPLIFIED SCIENCE PRO - NEW COURSE!

Artificial Intelligence Images & Drawings
Participants learn how to use cutting-edge AI tools for creating precise and professional scientific illustrations, bridging the gap between AI art generators and rigorous scientific communication standards.
- 5 lessons
- 1 hour of training video
- Download AI tool cheat sheets


All of the template files and training guides in one place! Click on the link above to download over 400 templates that will accelerate your scientific designs. Includes the popular Laboratory Tools and Biological Diagram templates, as well as templates for graphs, tables, and grants.
Upcoming Pro Course for 2026
- Affinity by Canva for Scientific Figures
- 3D Design in Adobe Illustrator + Templates!

Course Instructor
Dr. Karen Thiebes is a professional scientific illustrator and has a Ph.D. in Neuroscience. She has led scientific design courses for over 8 years and enjoys teaching participants how to quickly transform data into effective designs using Adobe Illustrator, PowerPoint, Affinity Designer, and Excel.
What do I get with Simplified Science Pro?
Go from zero to full design skills
Convenient comprehensive courses provide you with the step-by-step training to excel as a scientific illustrator. Less stress on finding the right tutorials, so you can focus on building skills.
Improve grant & publication rates
Improving the data visualizations and illustrations in your publications and grants has a positive impact on acceptance rates and audience understanding.
Expand your career options
The job market for researchers and graphic designers is competitive. Increasing your data visualization and scientific illustration skills is a great way to help you stand out from the crowd.
Download useful templates
Get access to hundreds of templates that allow you to quickly make professional designs, regardless of your skill level. The plan includes a download library with over 400 illustrations and Excel graphing template files.
Templates have a value of over $90 and include the popular Biological Diagram and Laboratory Tool templates.