

Simplified Science Resources

Learn how you can ethically use AI image generators to improve your graphics for scientific publications by using AI vector output as the base for your own unique illustrations.
Scientific presentations are detailed talks that showcase a research project or analysis results. This comprehensive guide reviews everything you need to know to give an engaging presentation for scientific conferences, lab meetings, and PhD thesis talks.

Data storytelling is a powerful tool that makes your data visualizations memorable and easy to understand. Learn how to create your own effective data stories using these four steps.
Professional PowerPoint templates and slide design examples for science talks, academic conferences, and graduate thesis presentations.
Creating engaging research posters is an important skill for every scientist. This guide provides design tips and detailed tutorials for making posters using free templates.
Creating good graphical abstracts for scientific papers requires using design best practices to make an illustrated summary that clearly shows the main point of your research.
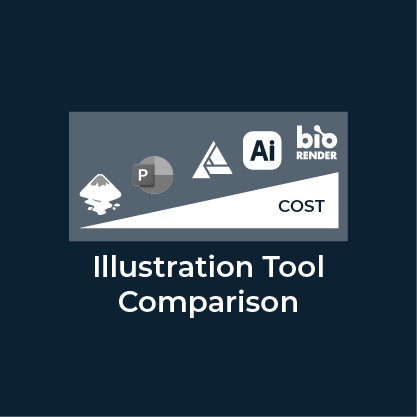
Compare popular scientific illustration software costs, pros and cons for BioRender, Image Databases, Adobe Illustrator, Affinity Designer, Inkscape, Google Drawing, PowerPoint and Google.
This guide provides links to resources for scientists who want to learn how to use Adobe Illustrator to create professional figures for their publications and presentations.
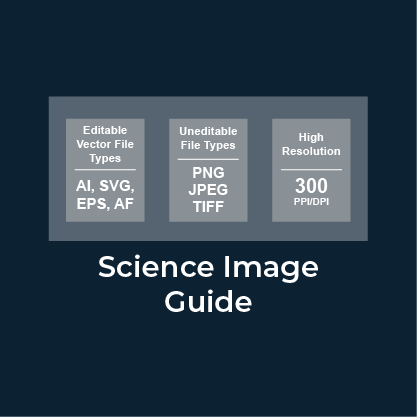
Everything you need to know about using science images in your research papers, including matching the copyright, resolution, and sizing rules that allow them to be used in figures and presentations.
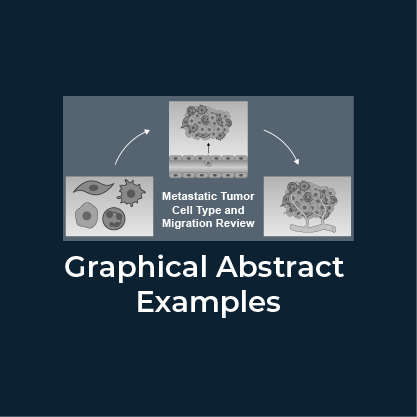
Creating engaging graphical abstracts can improve scientific publication rates and allows you to easily share your research in presentations and social media.
Explore science drawings for research applications and get expert tips on how to create your own illustrations. Drawings in include petri dishes, test tubes, syringes, cell types, and animal models.

Learn how to create engaging figures and data visualizations for scientific publications by applying these data presentation design best practices.