Get in touch
555-555-5555
mymail@mailservice.com


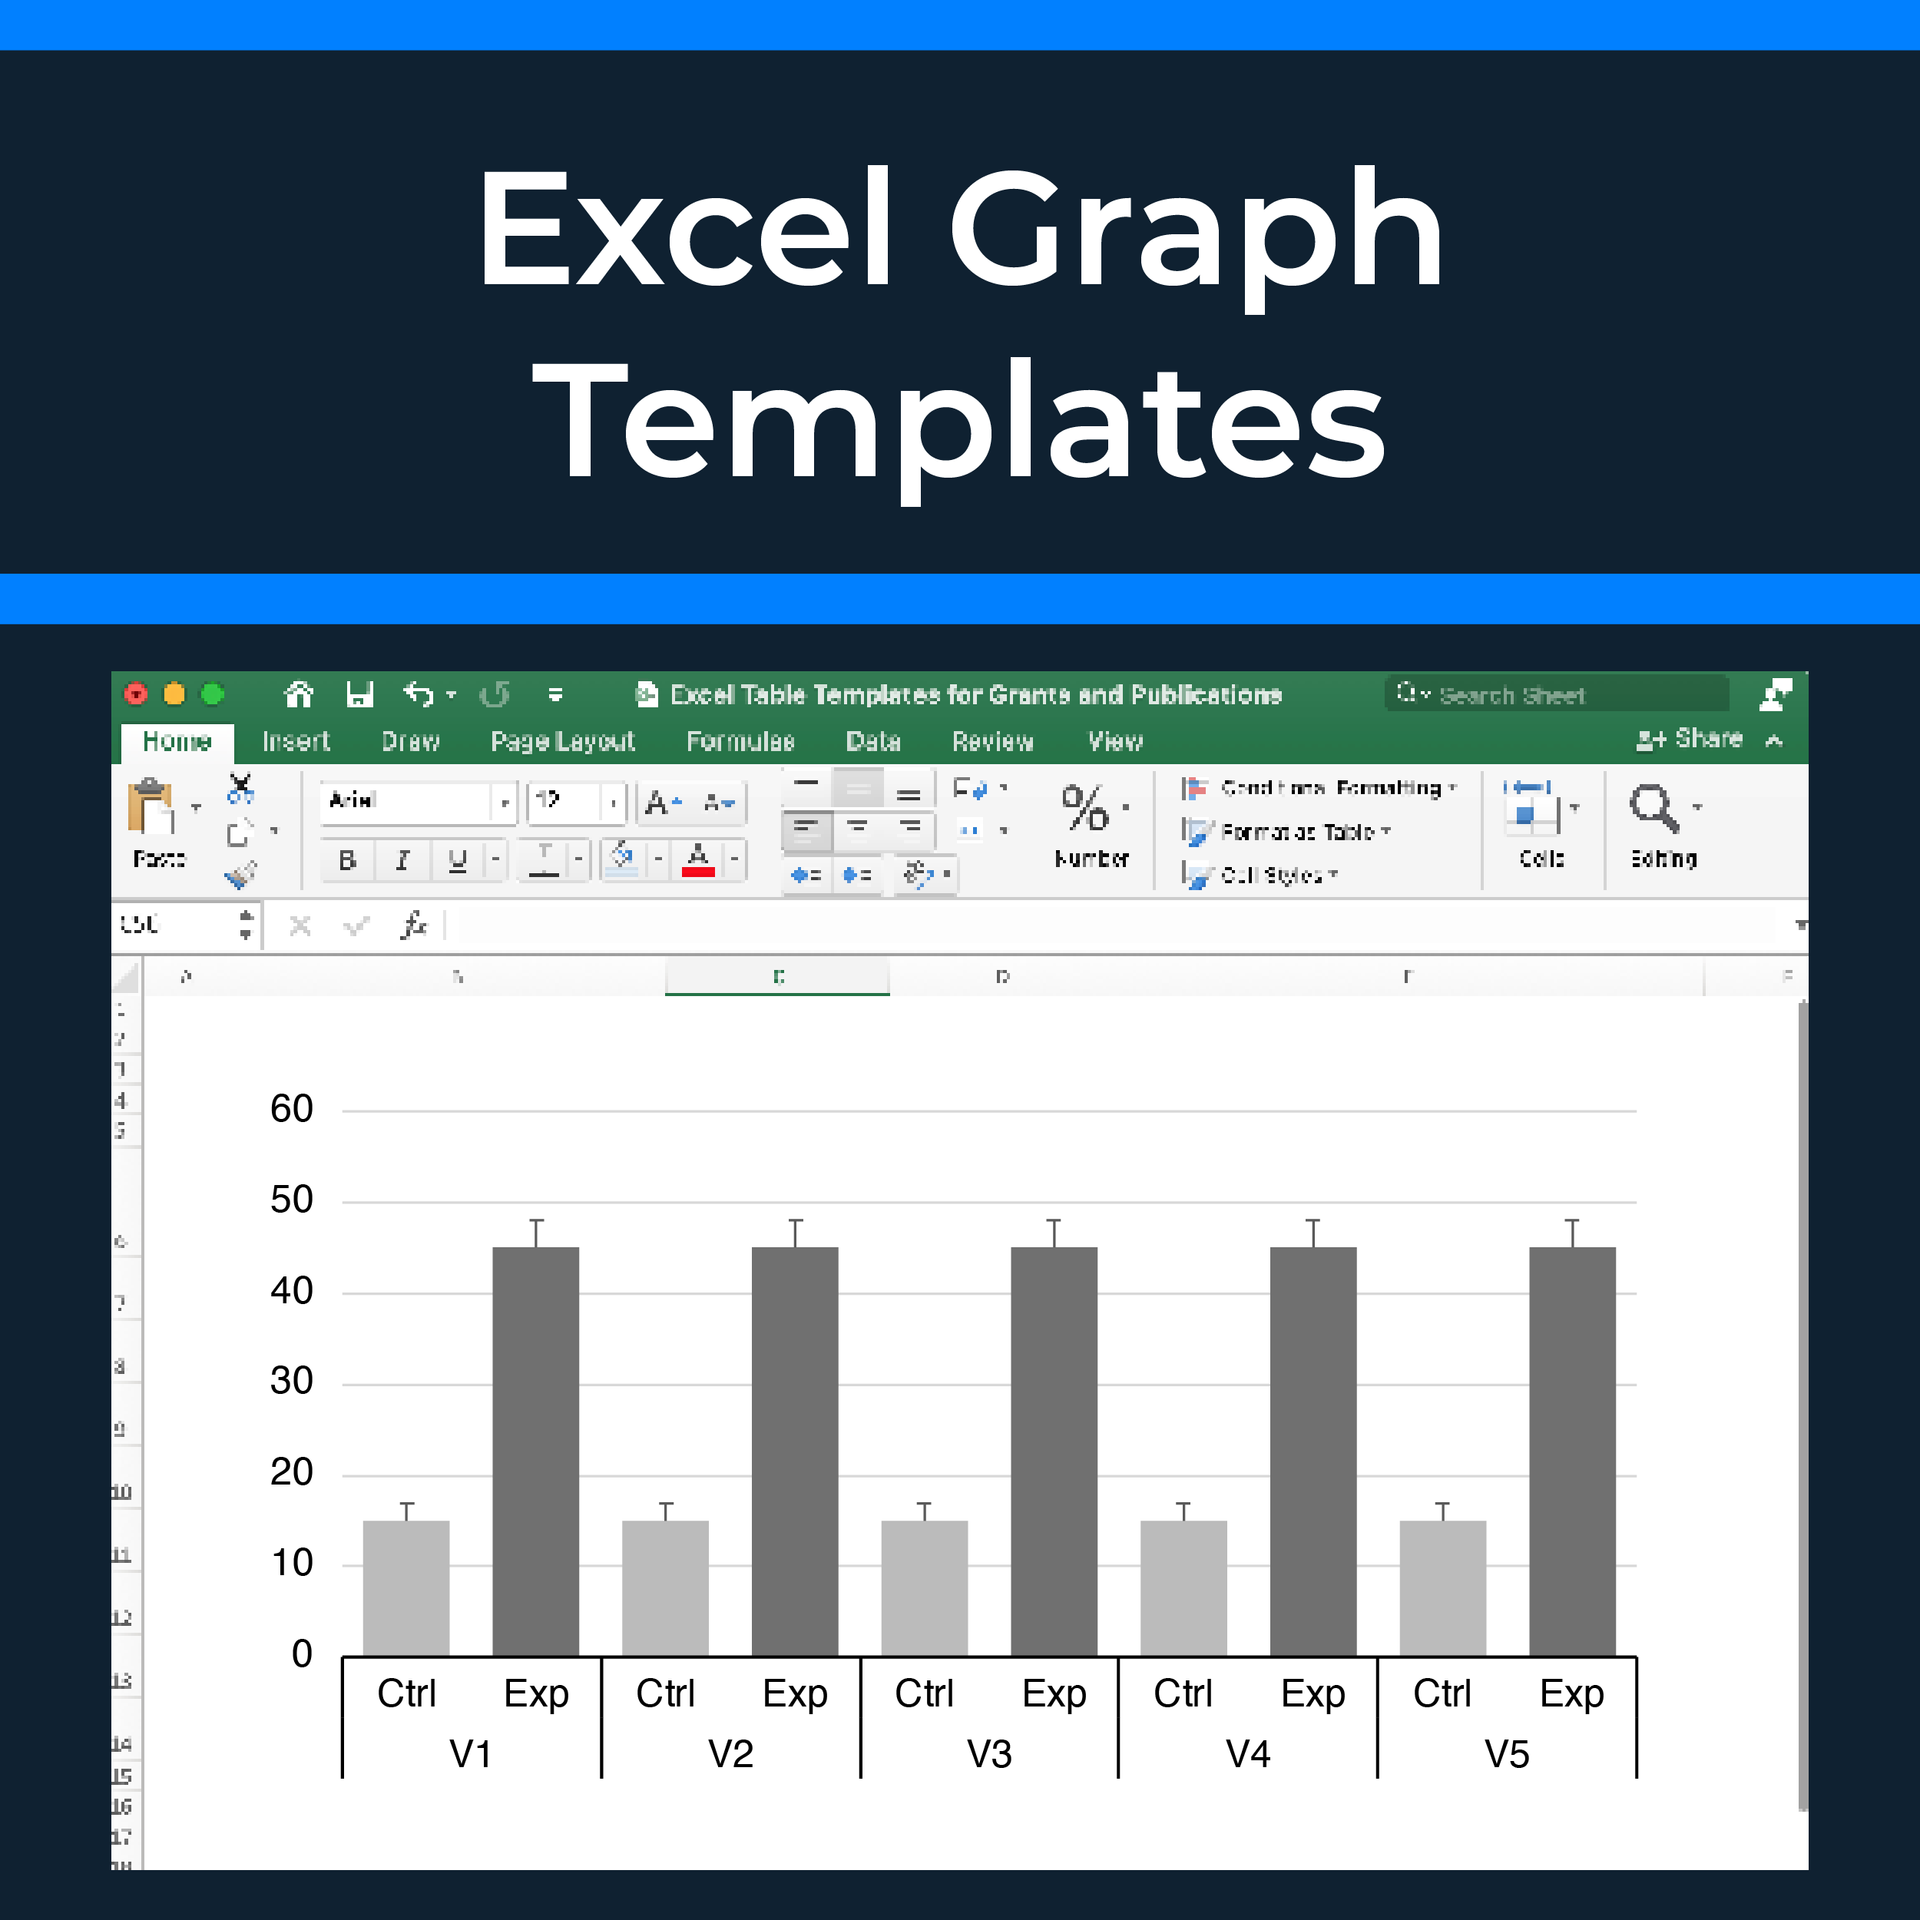


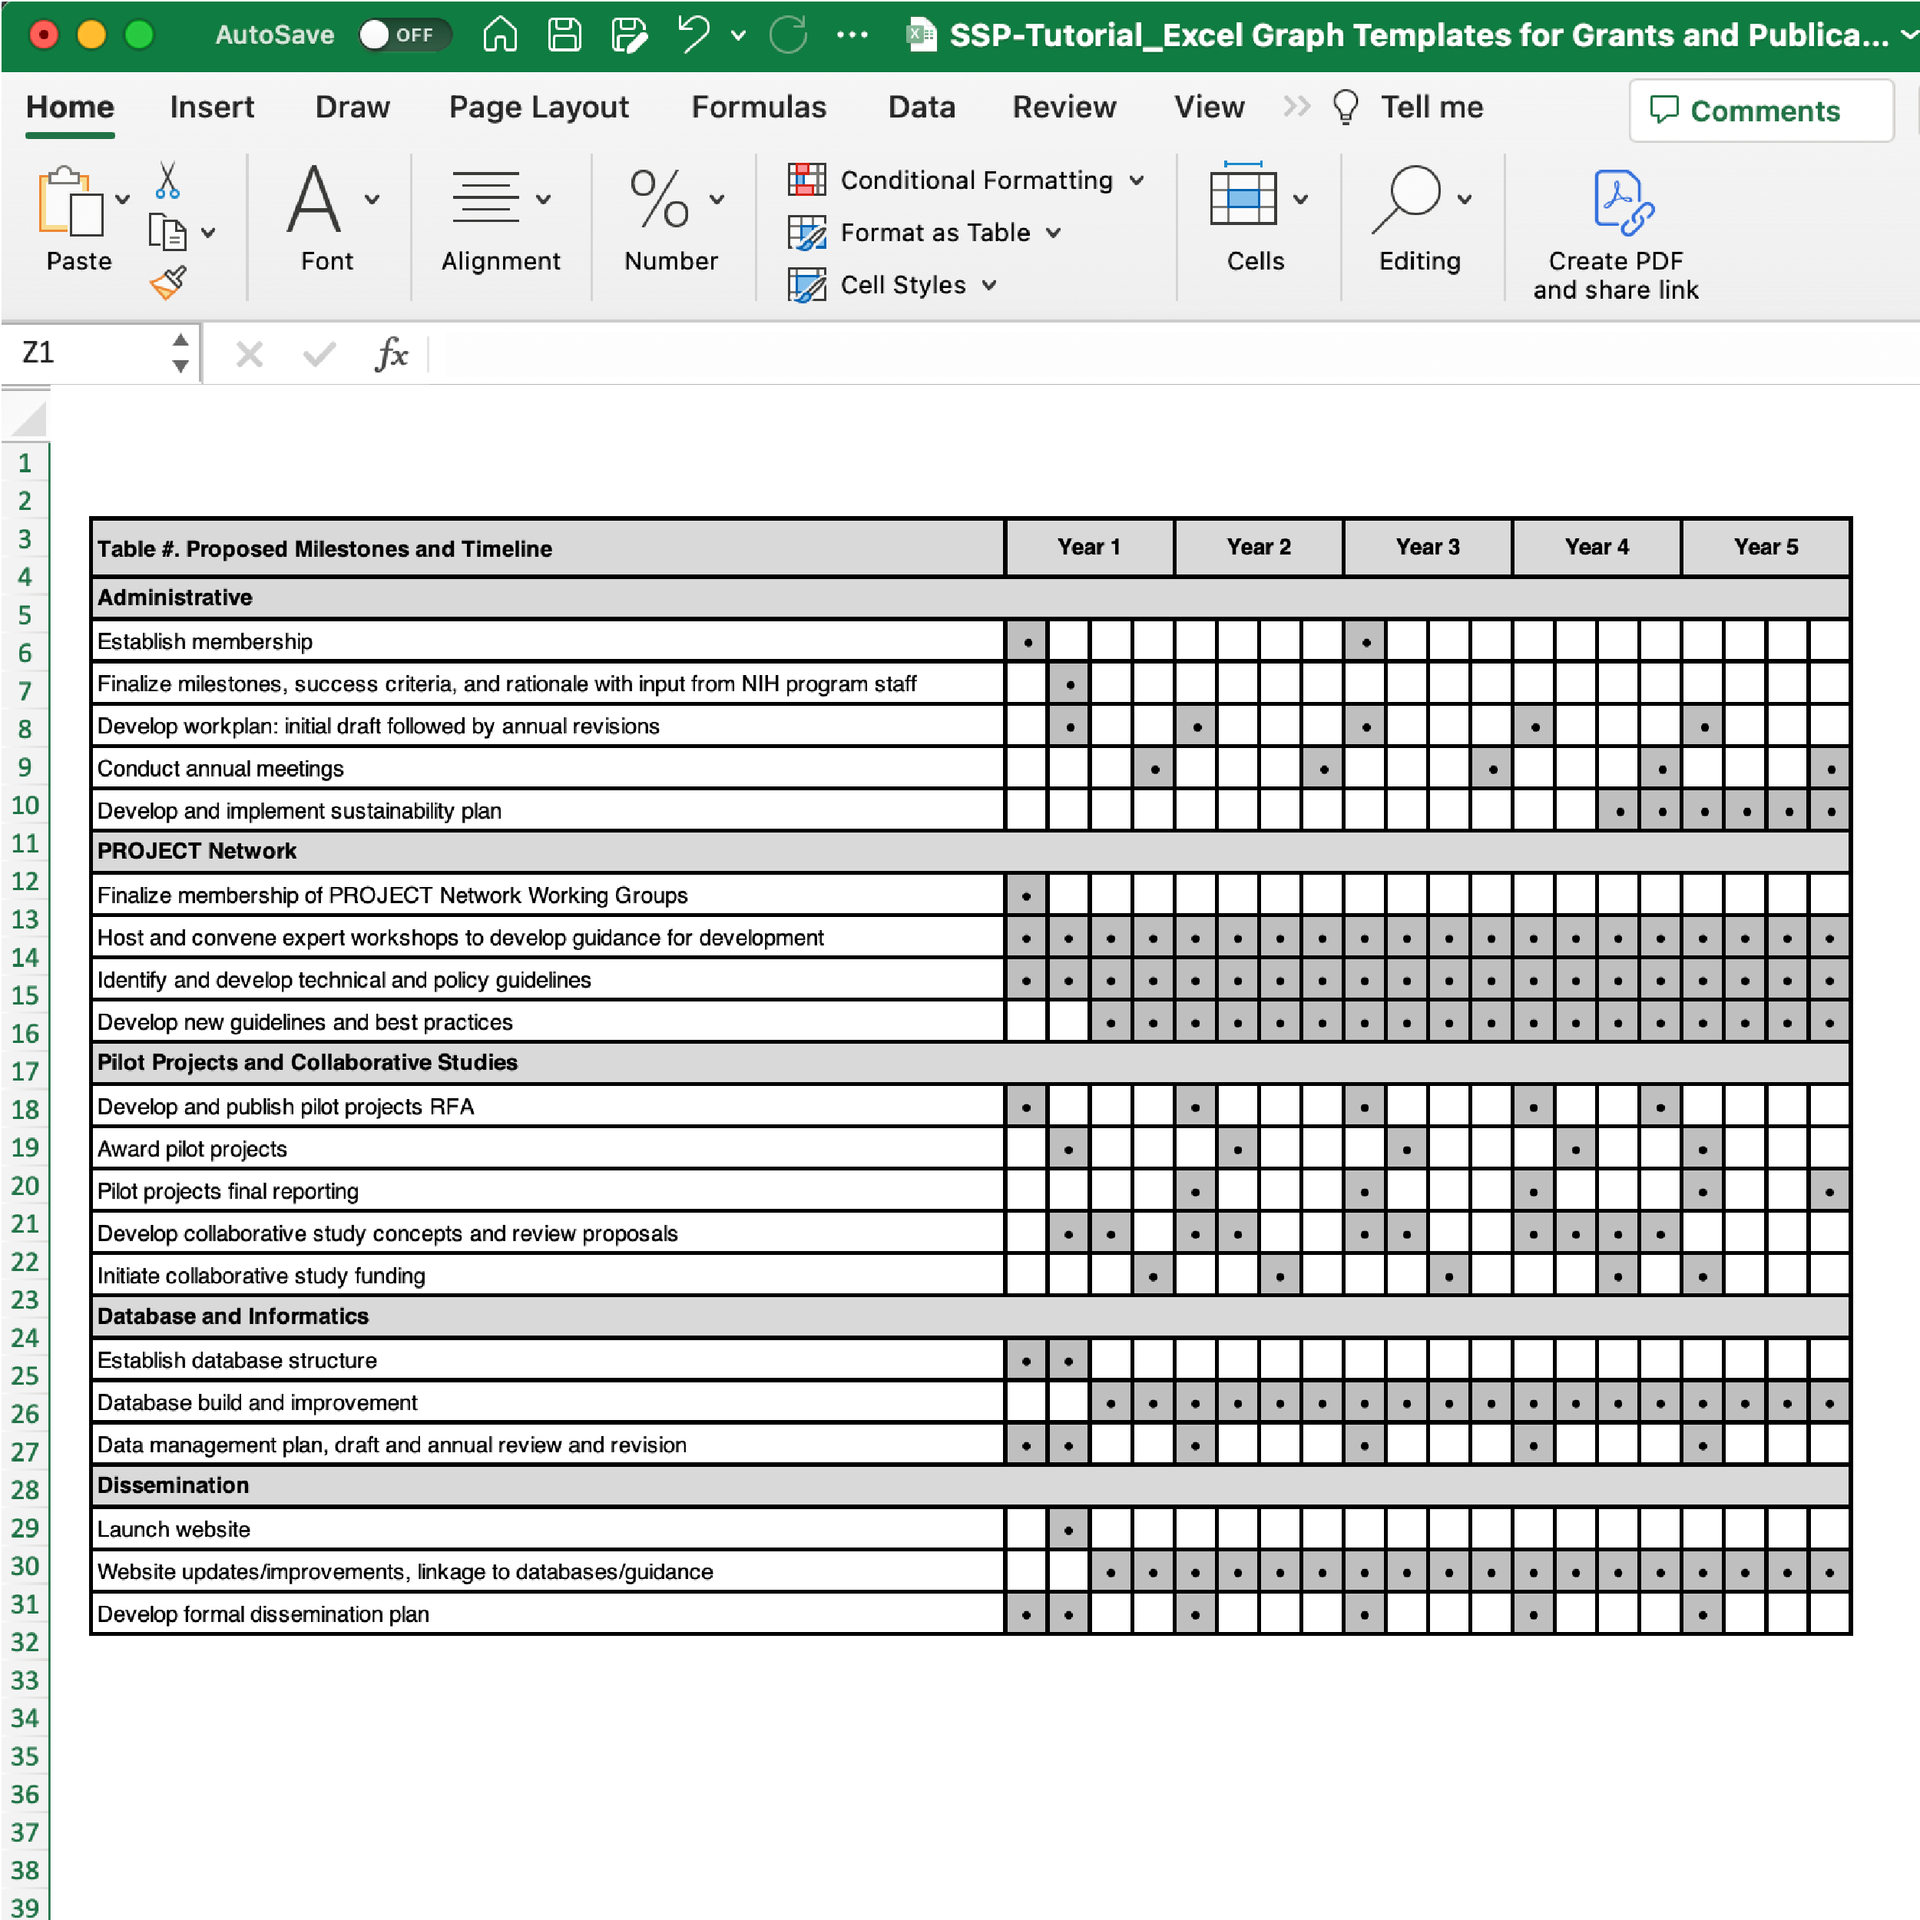
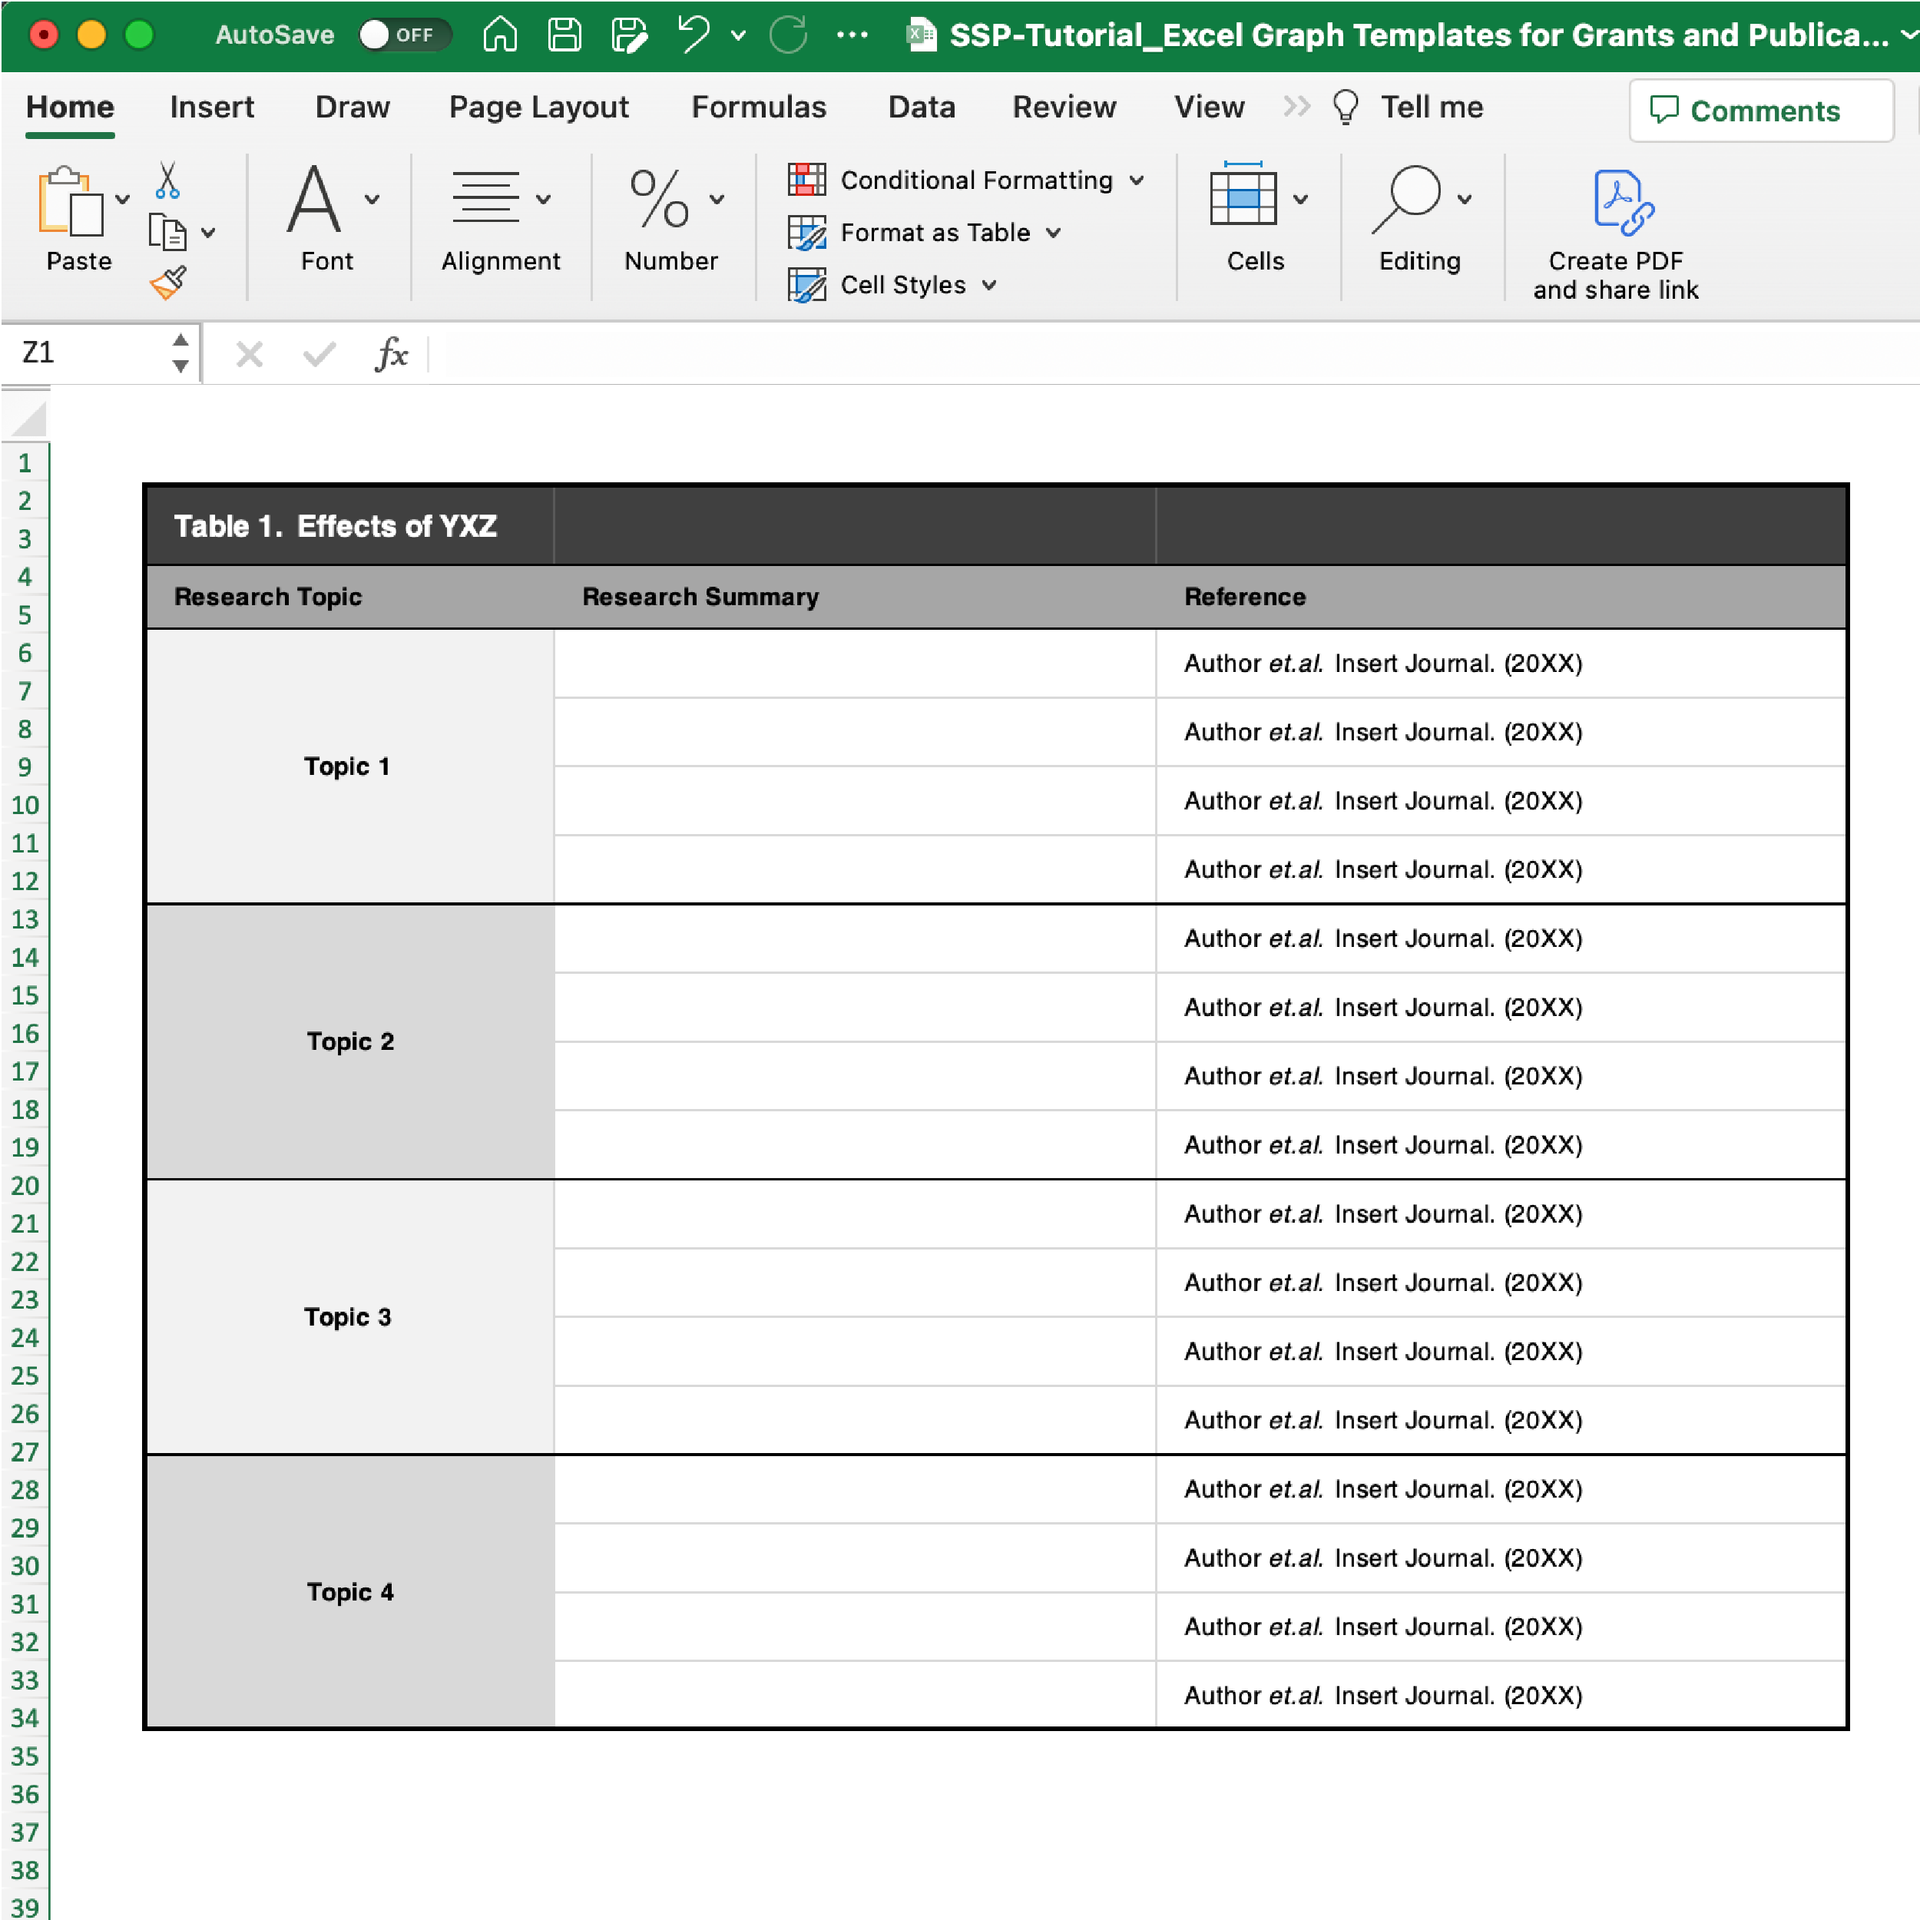
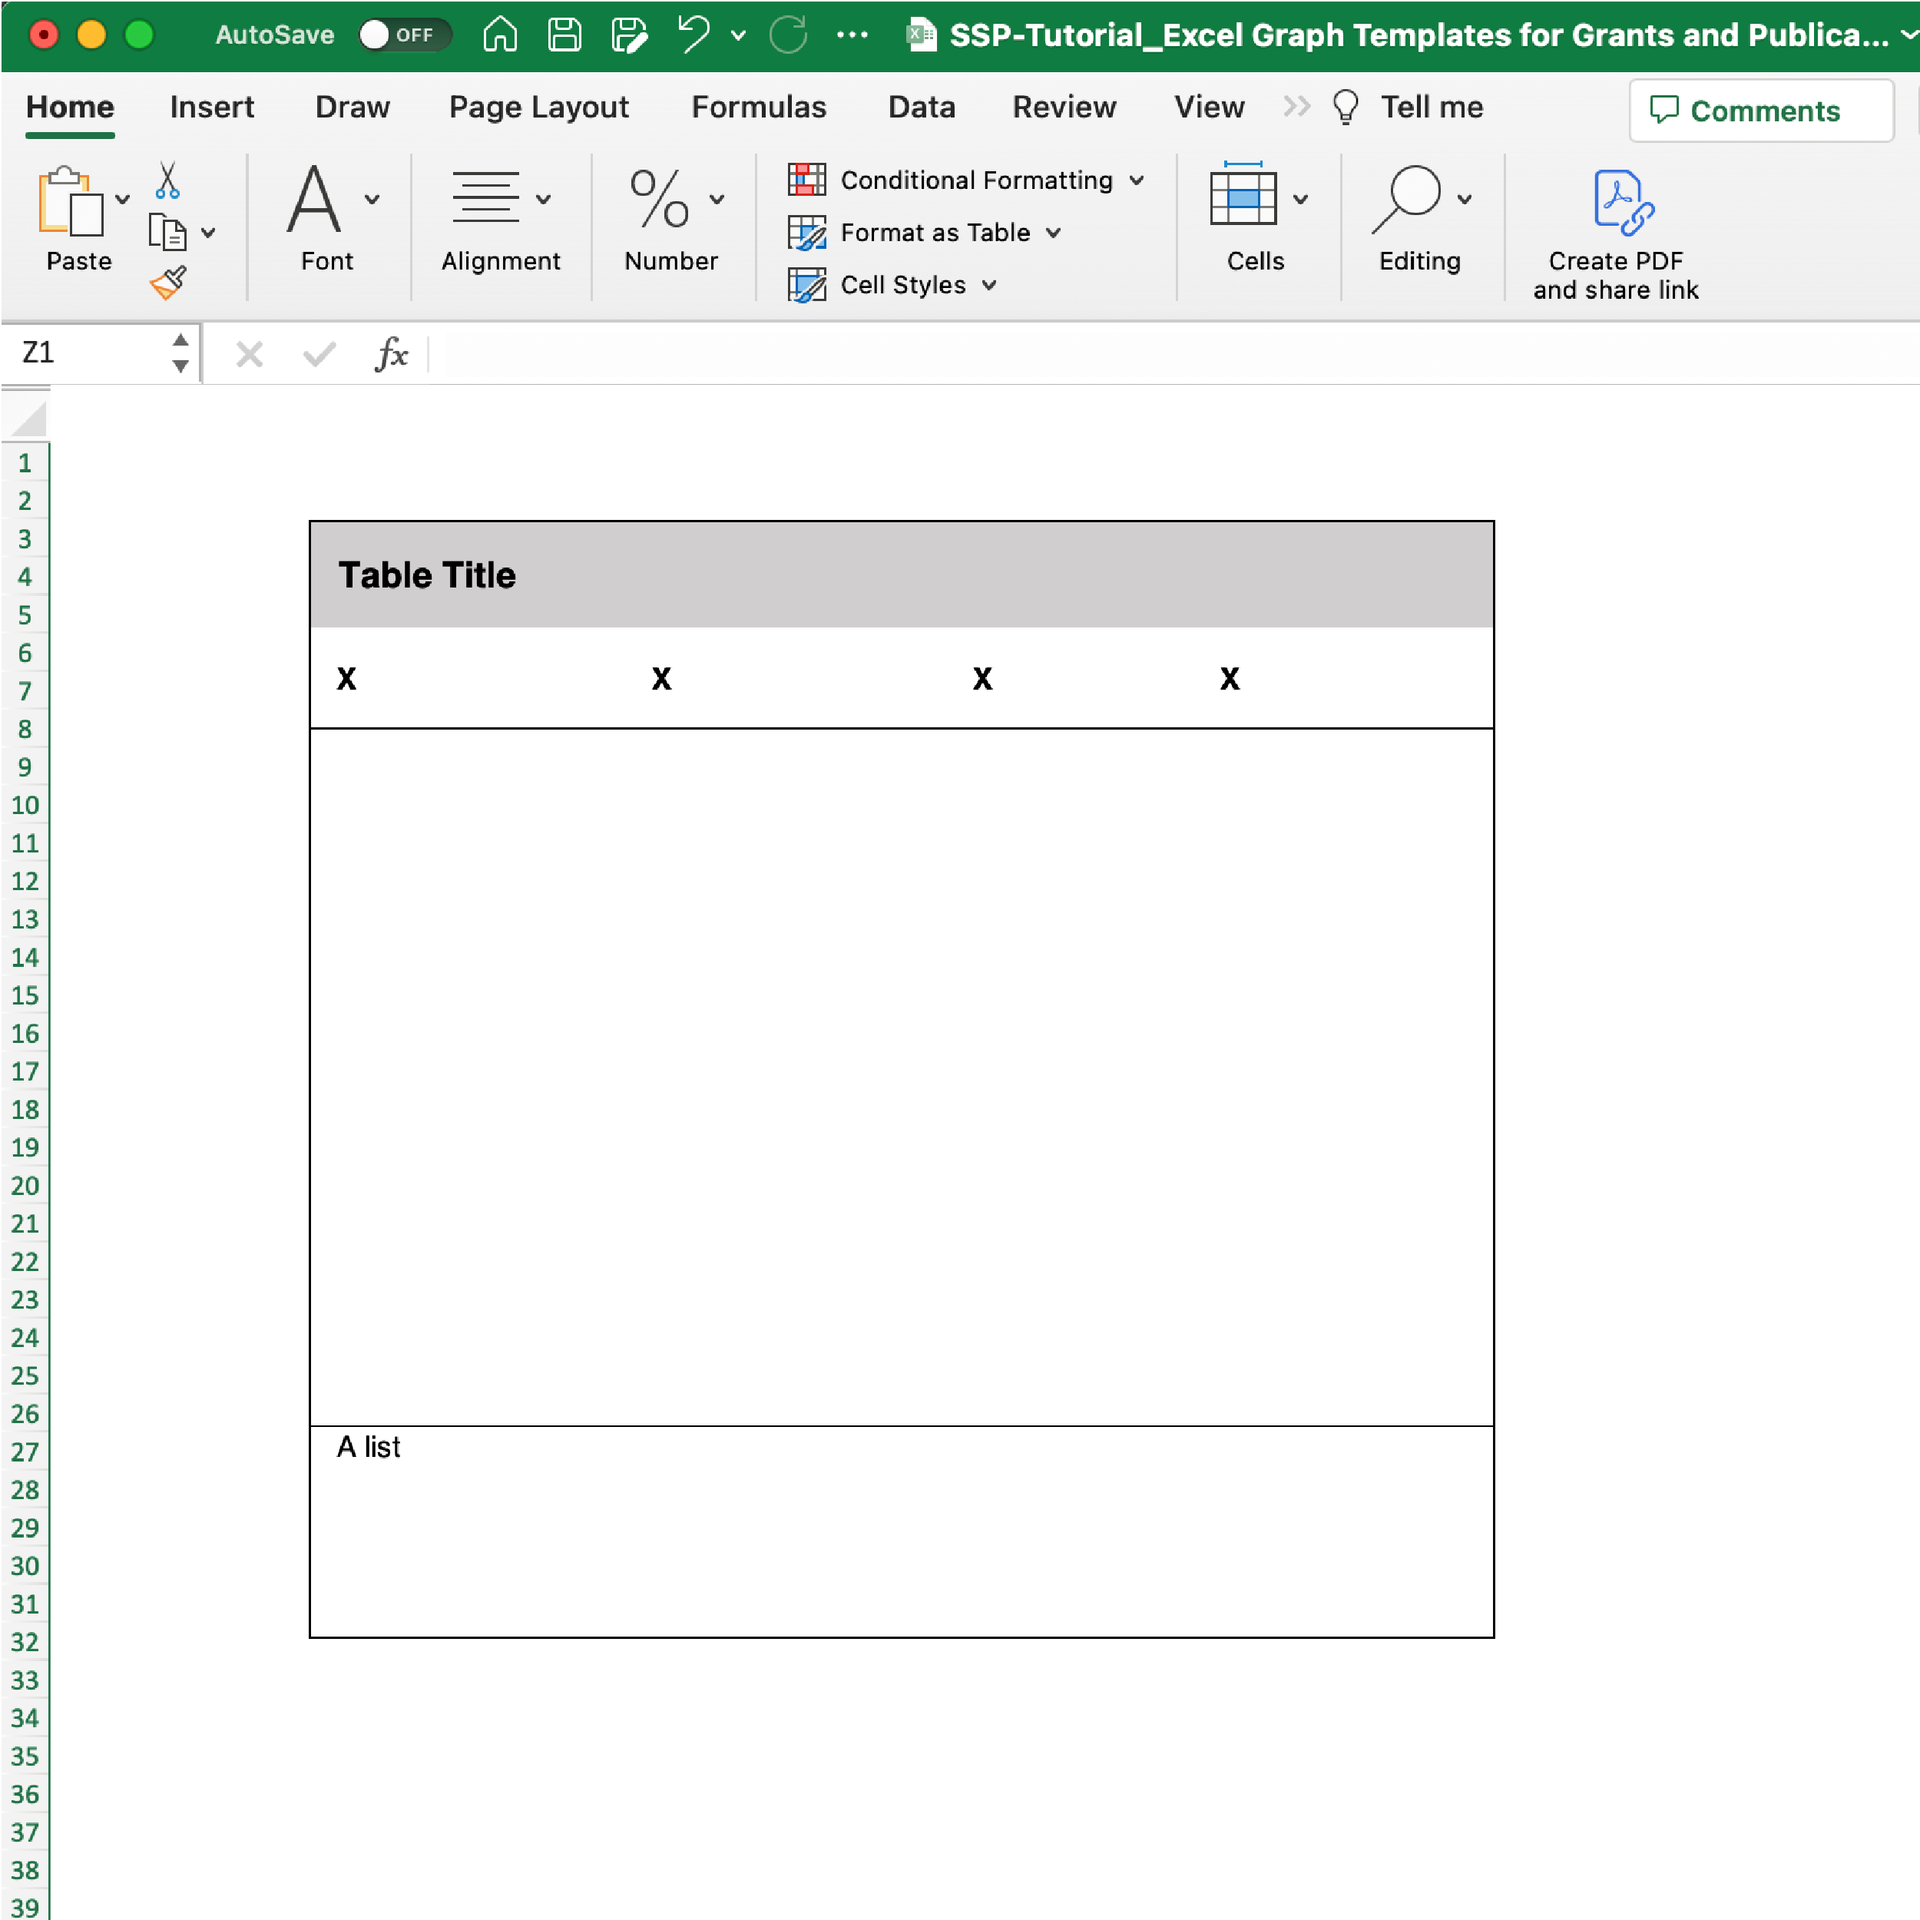
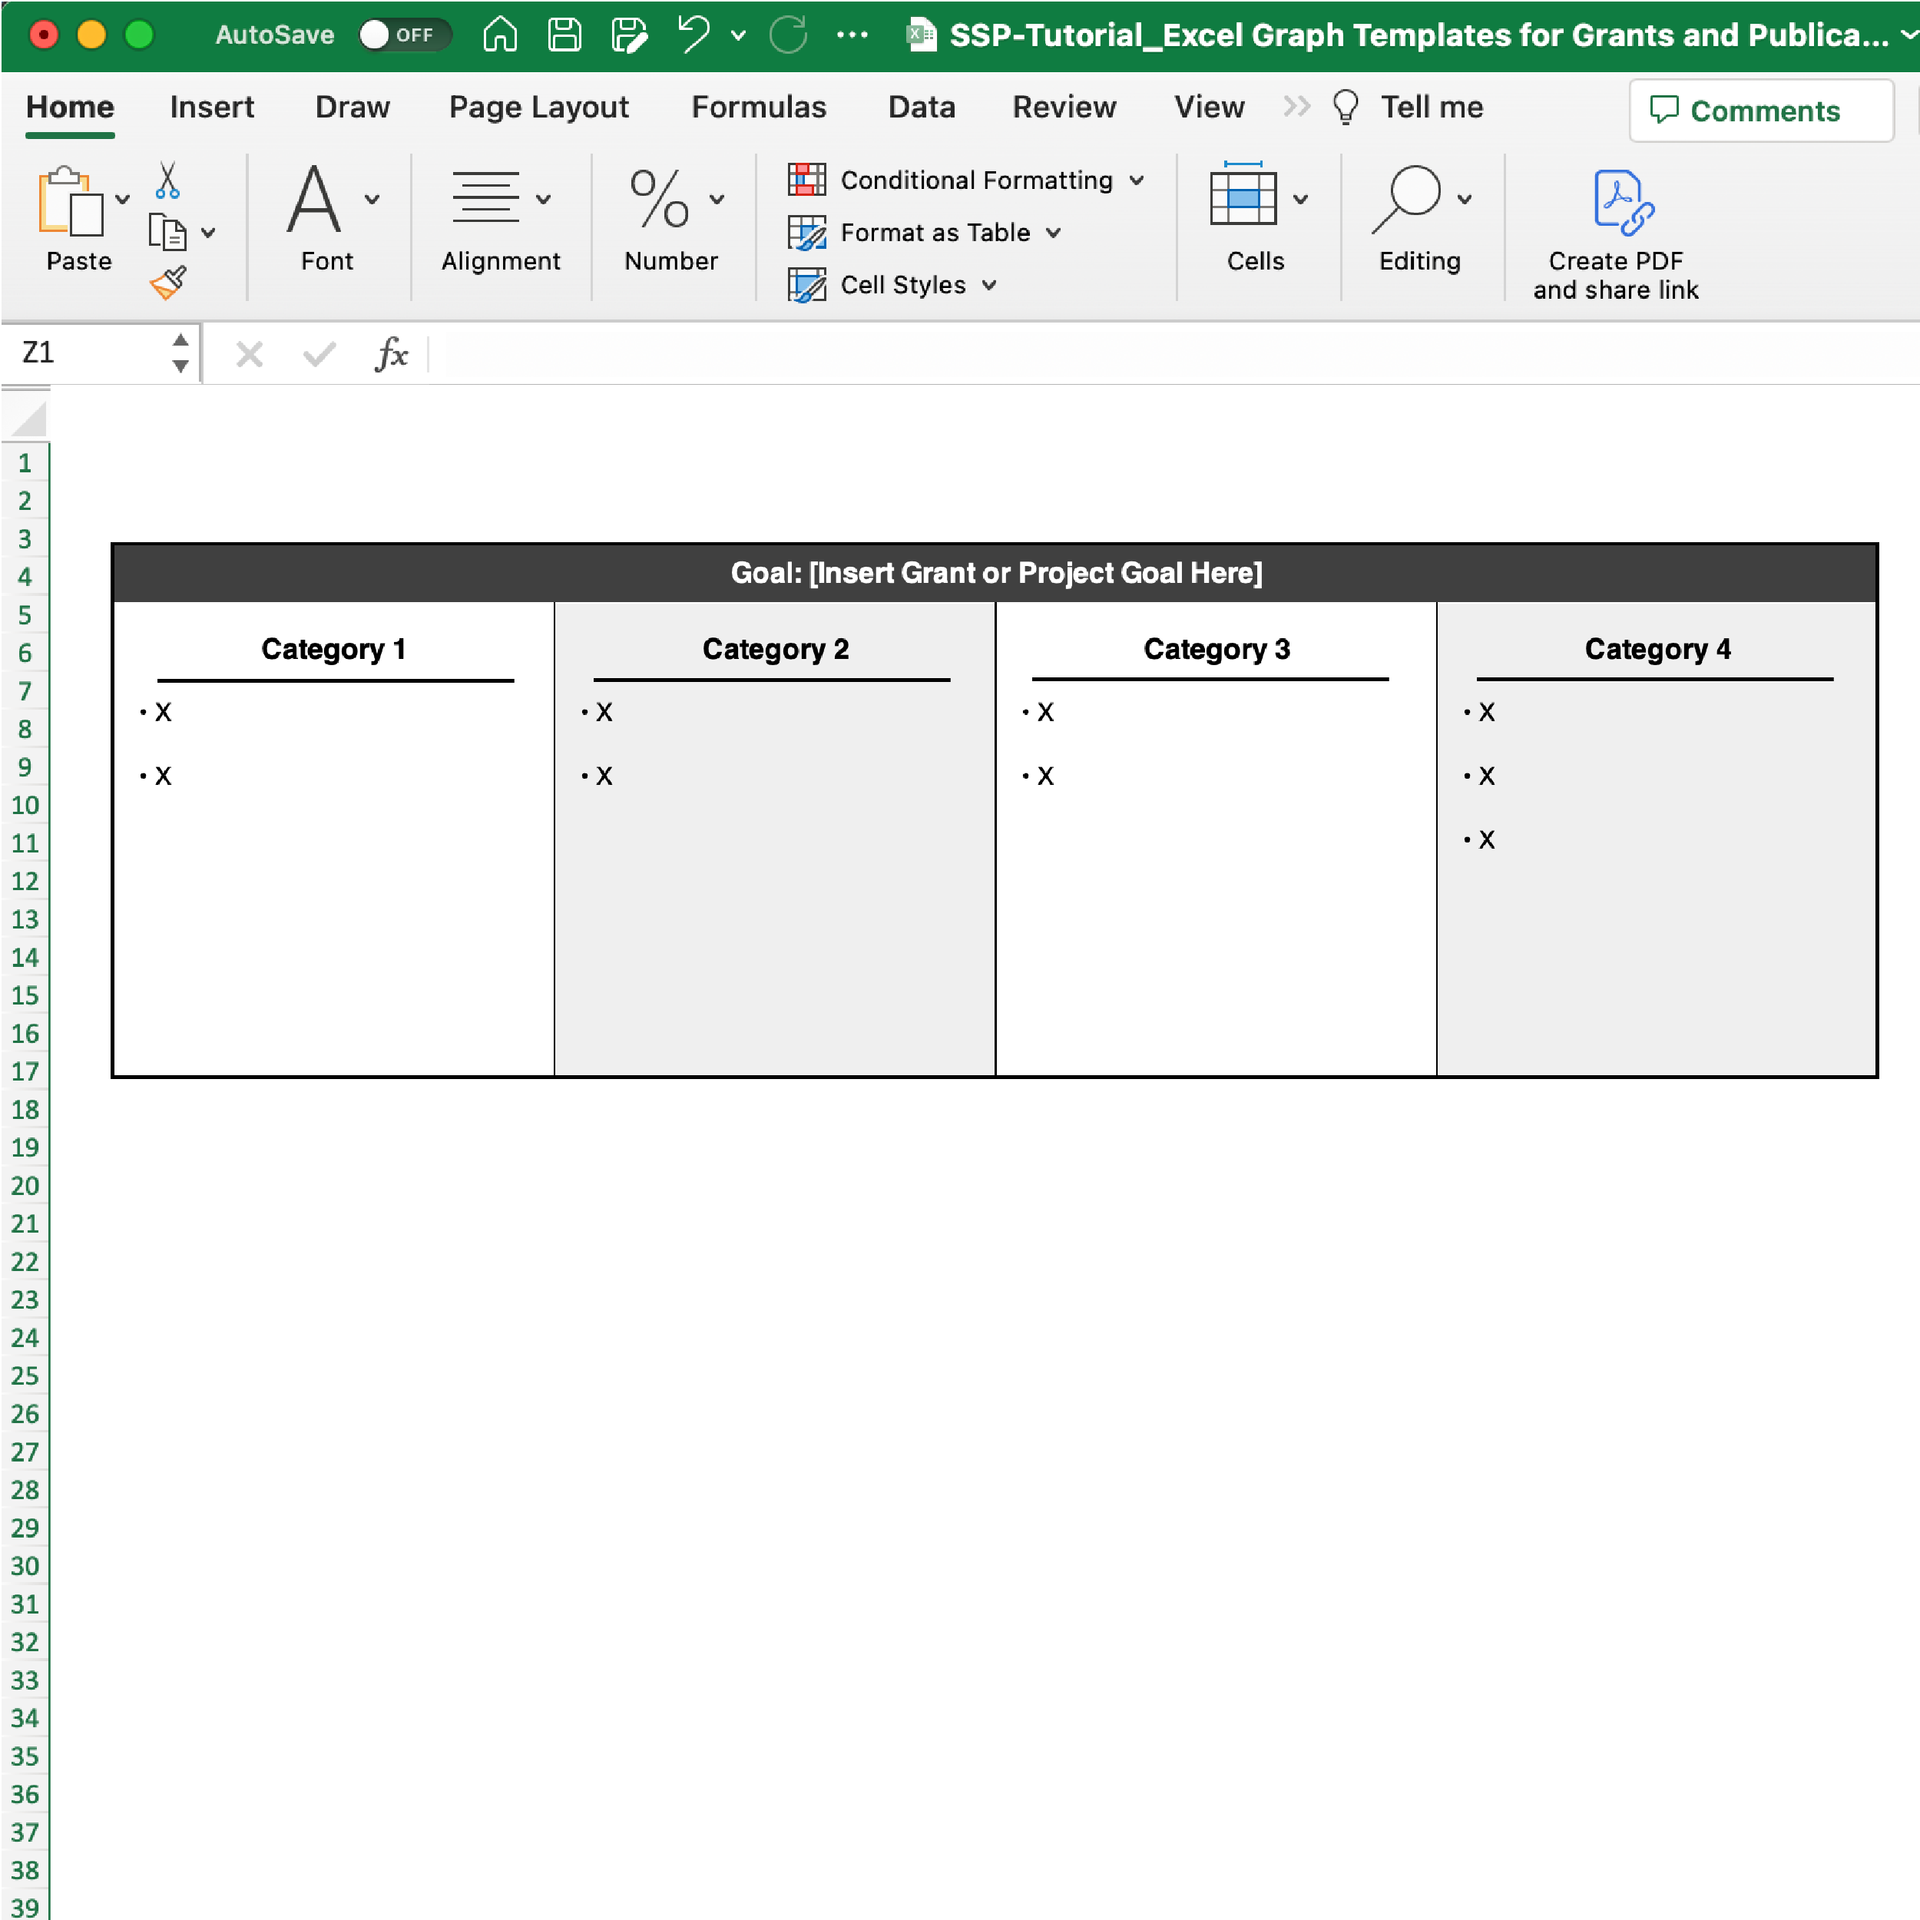
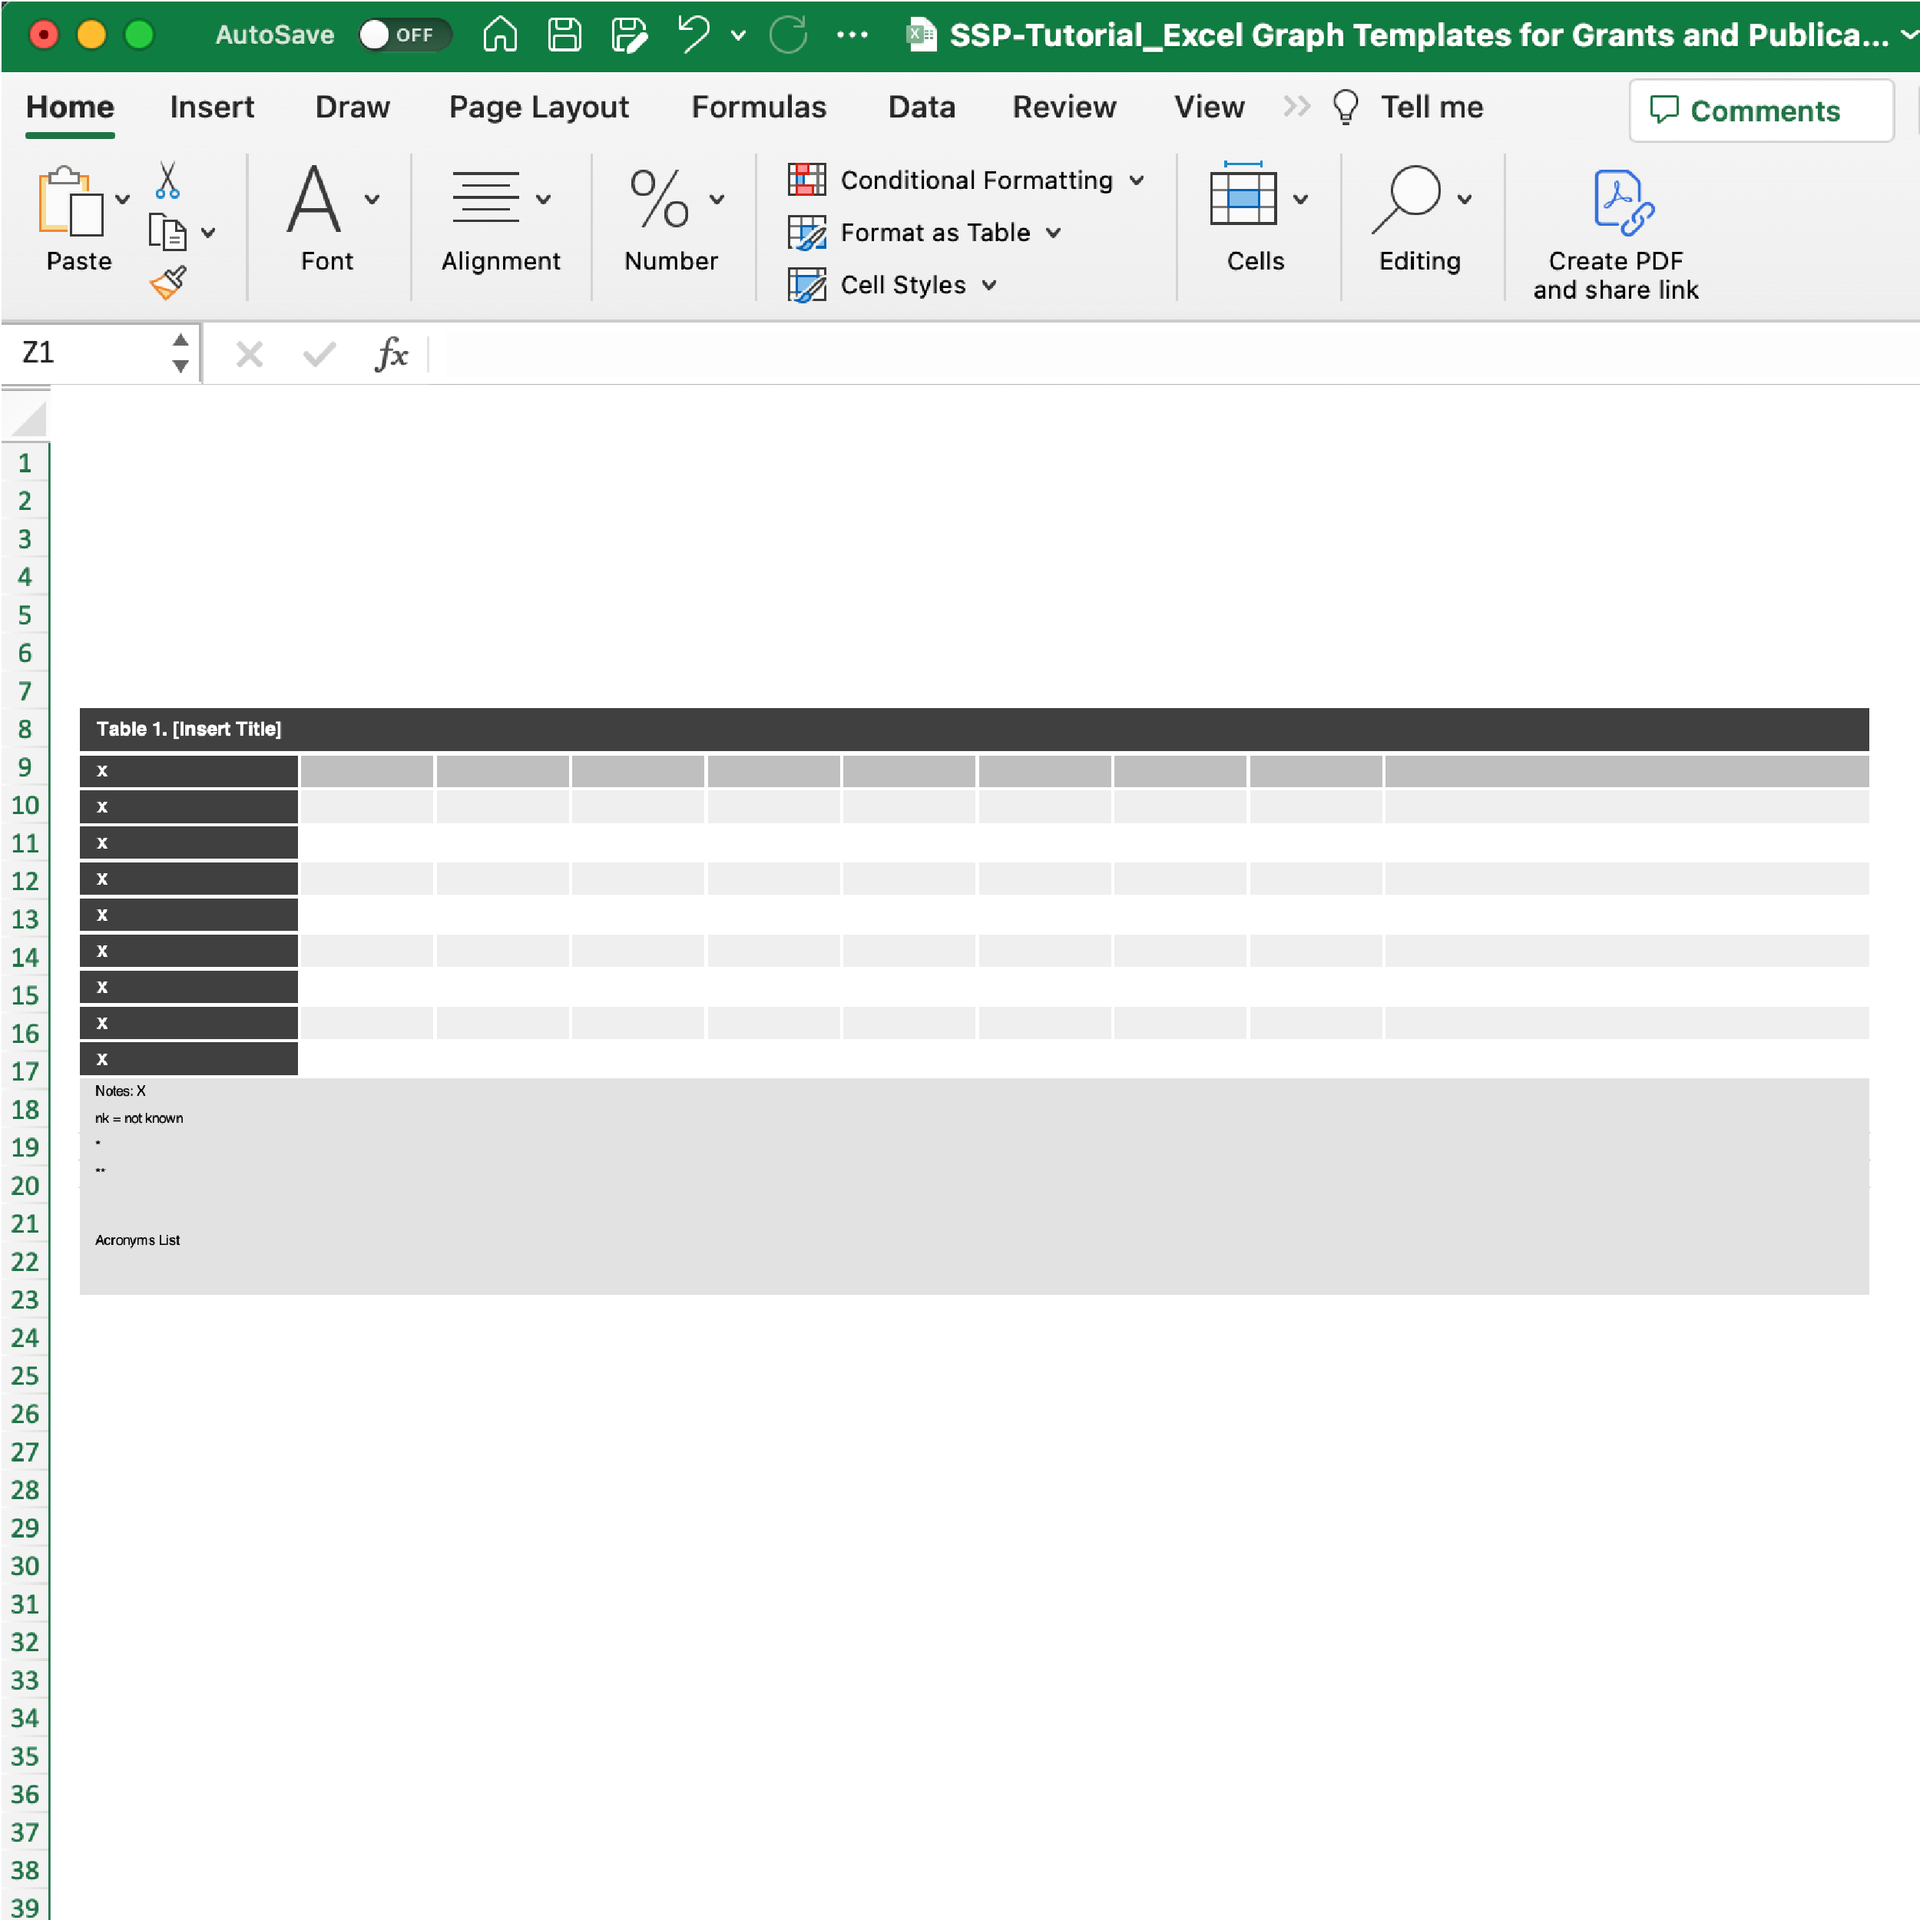
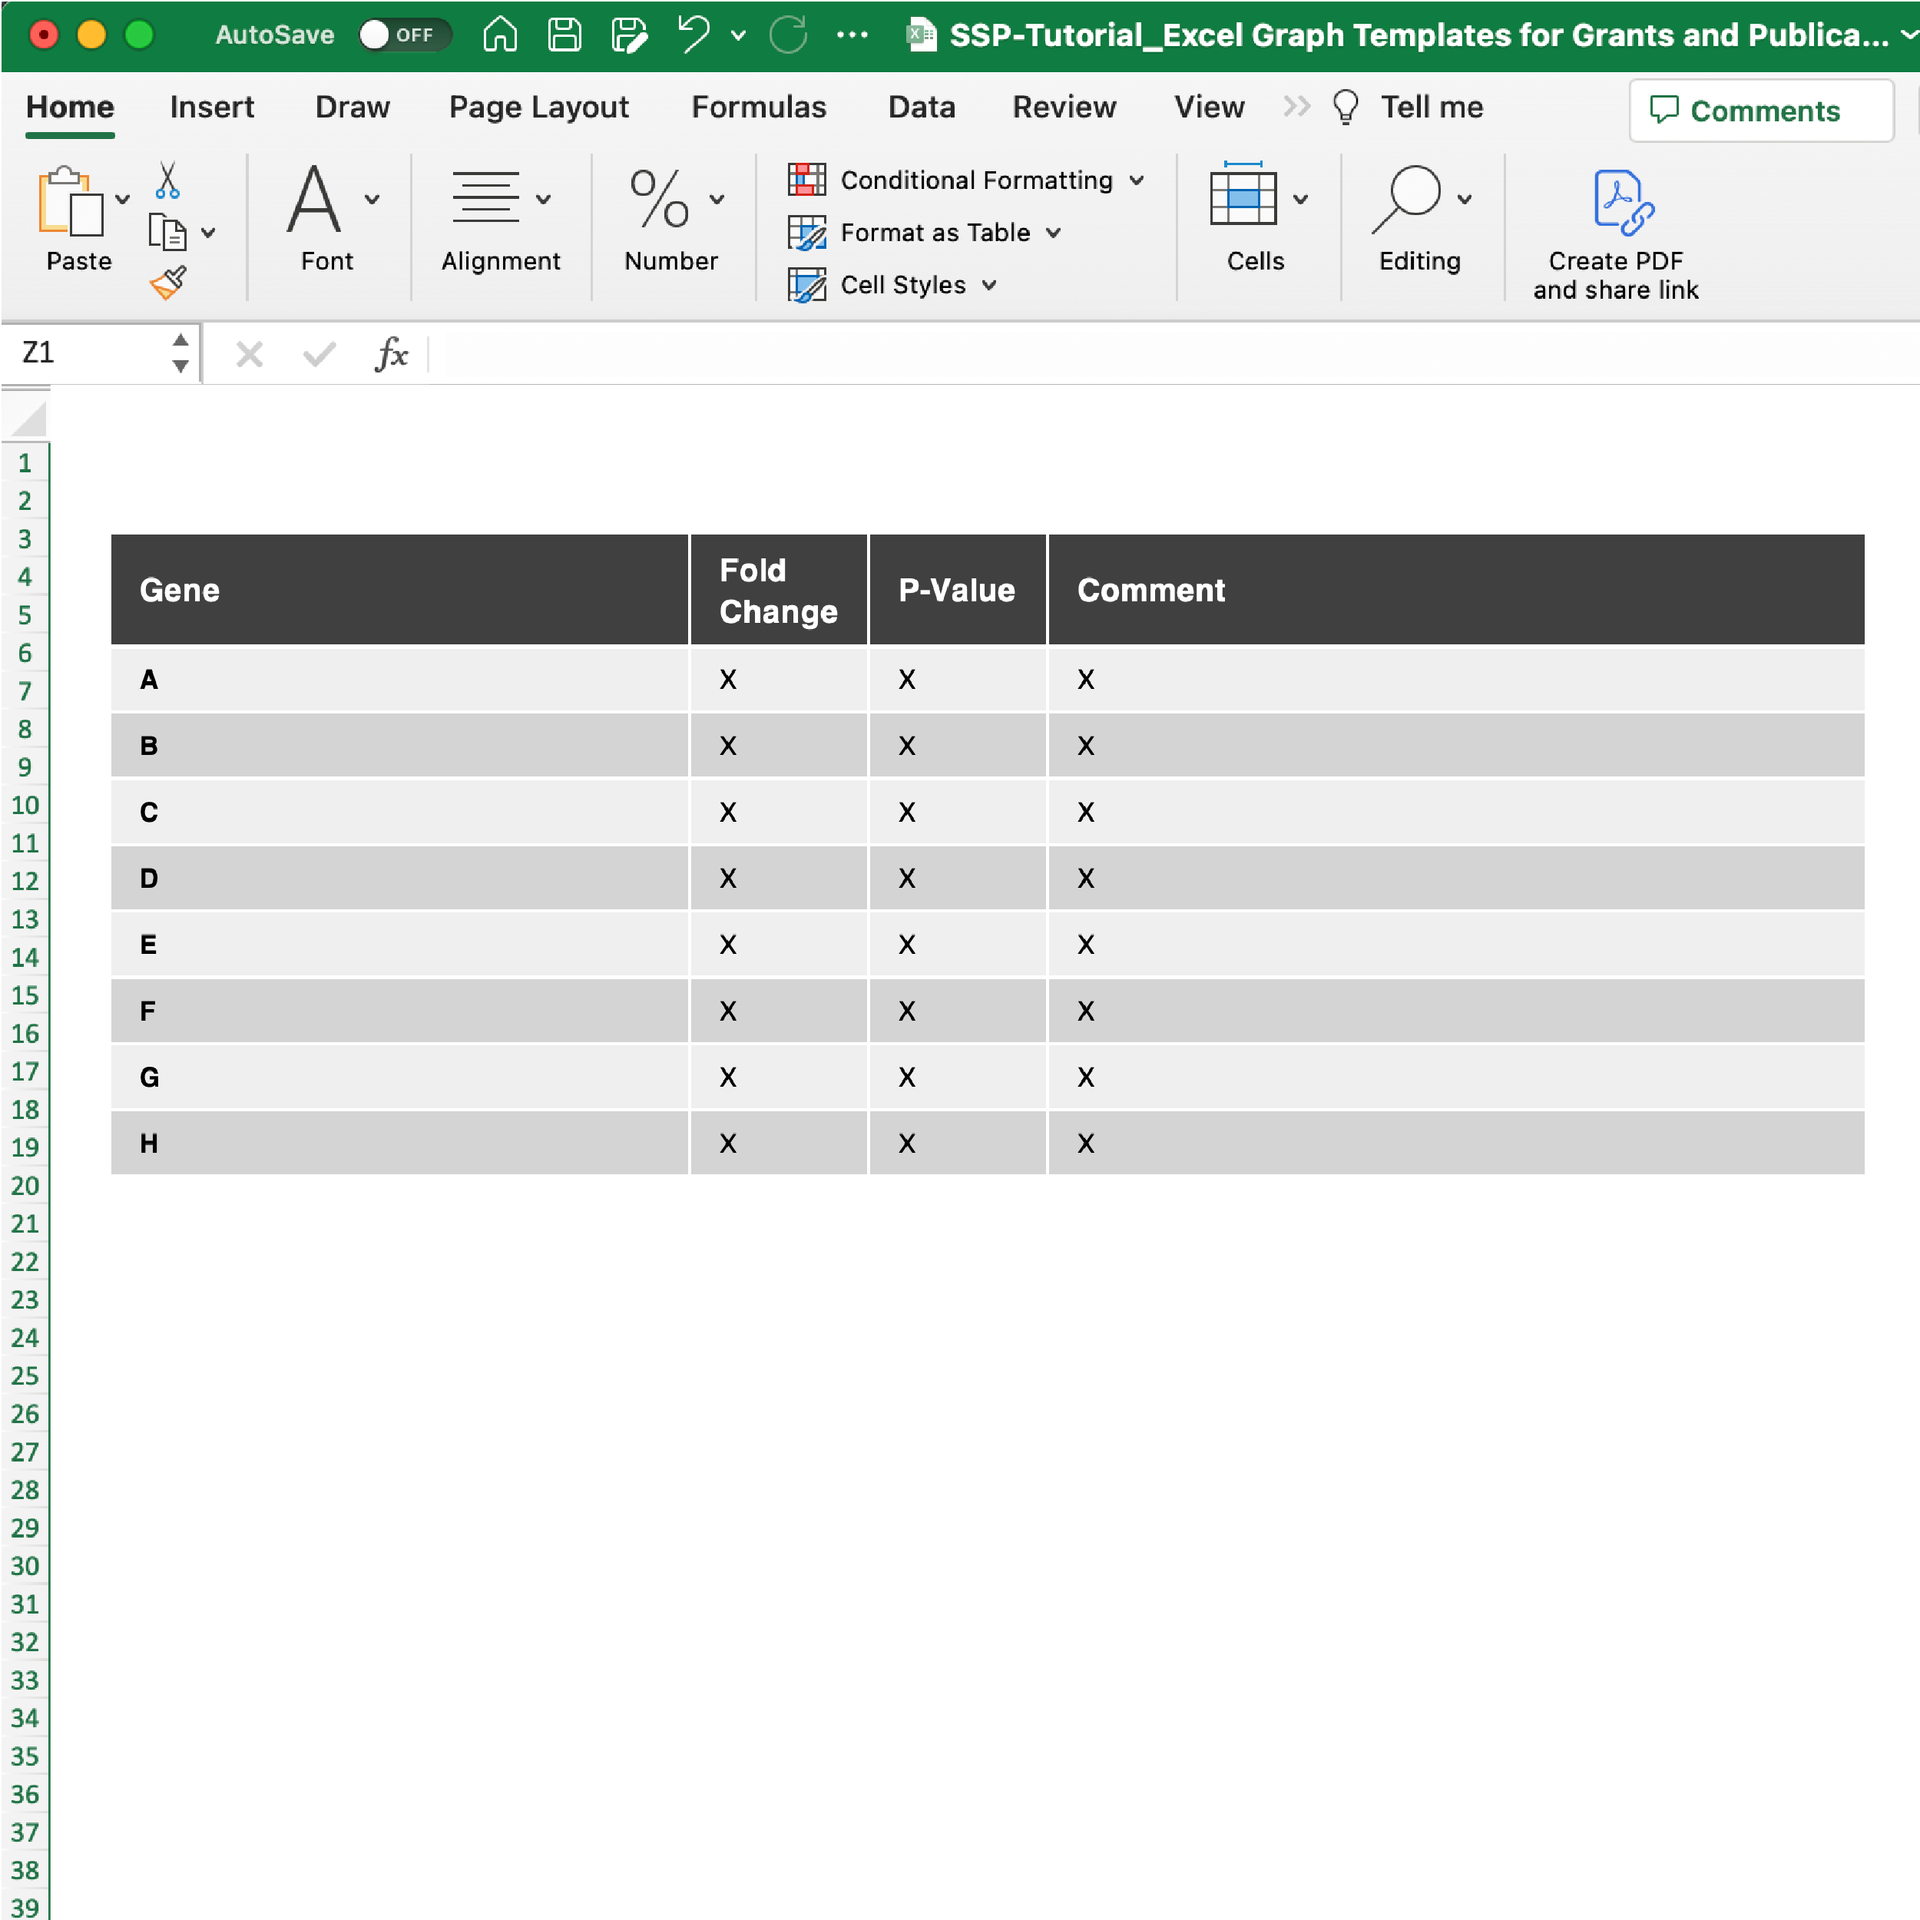
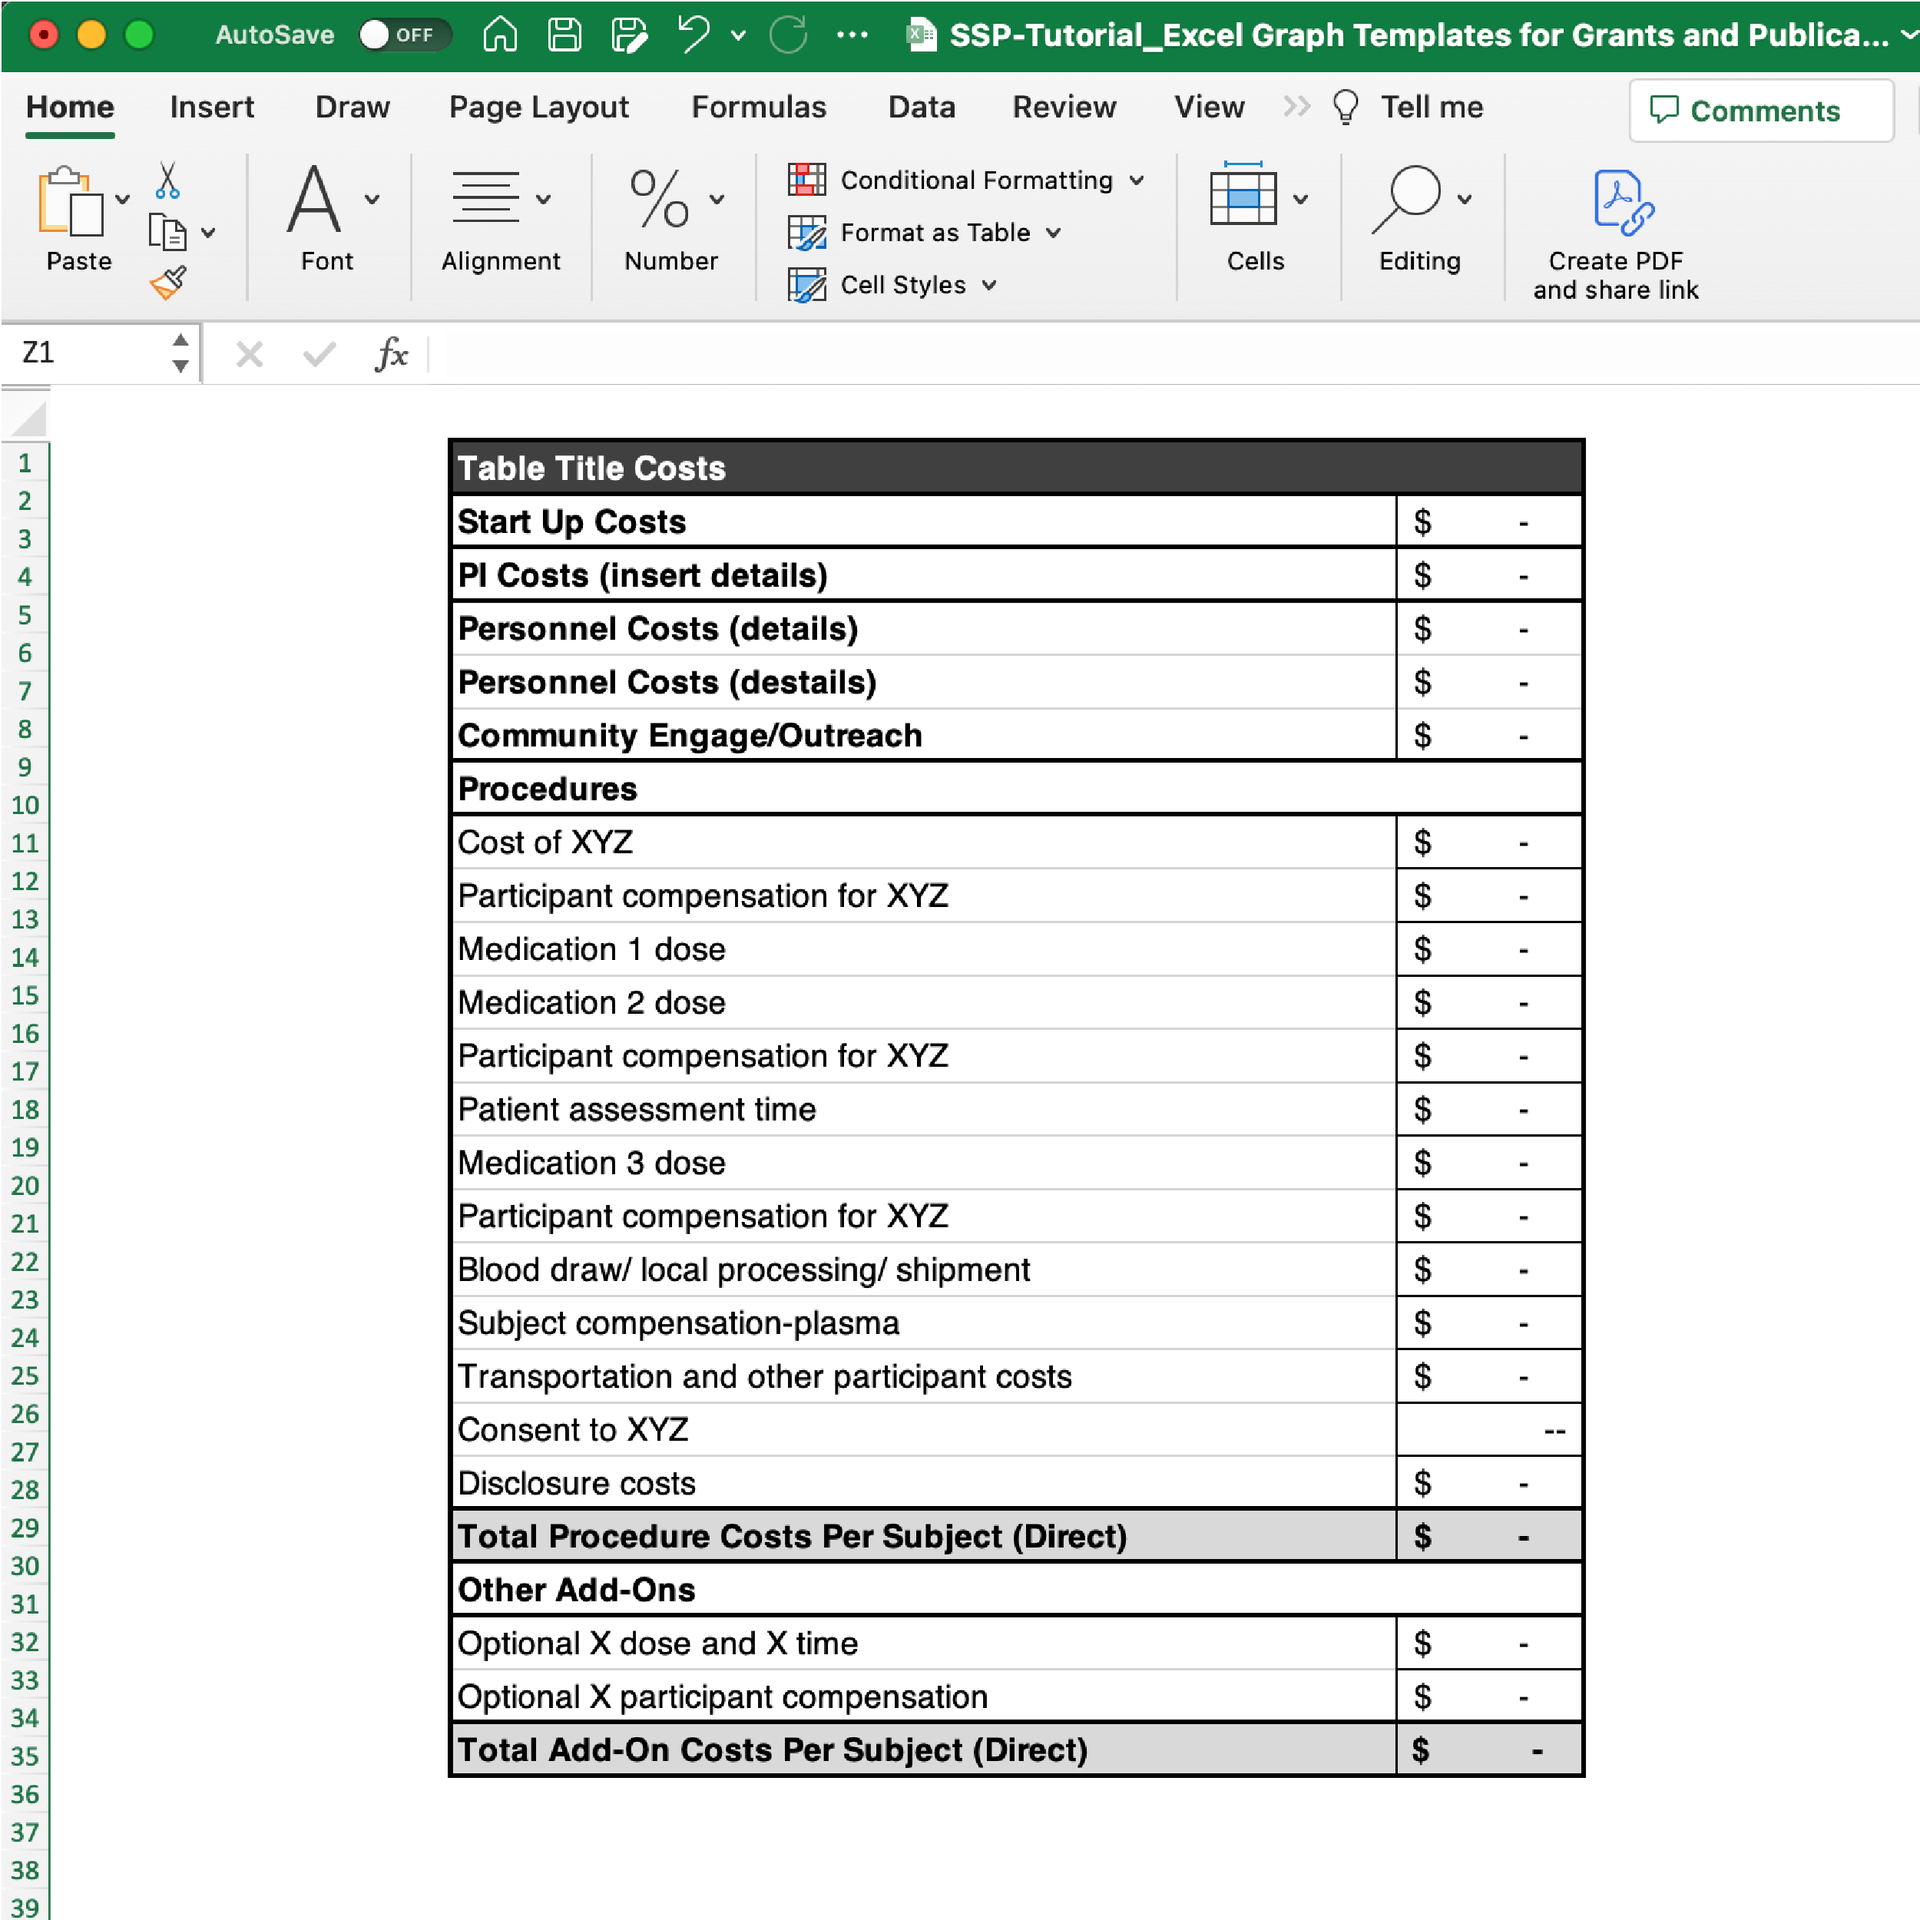
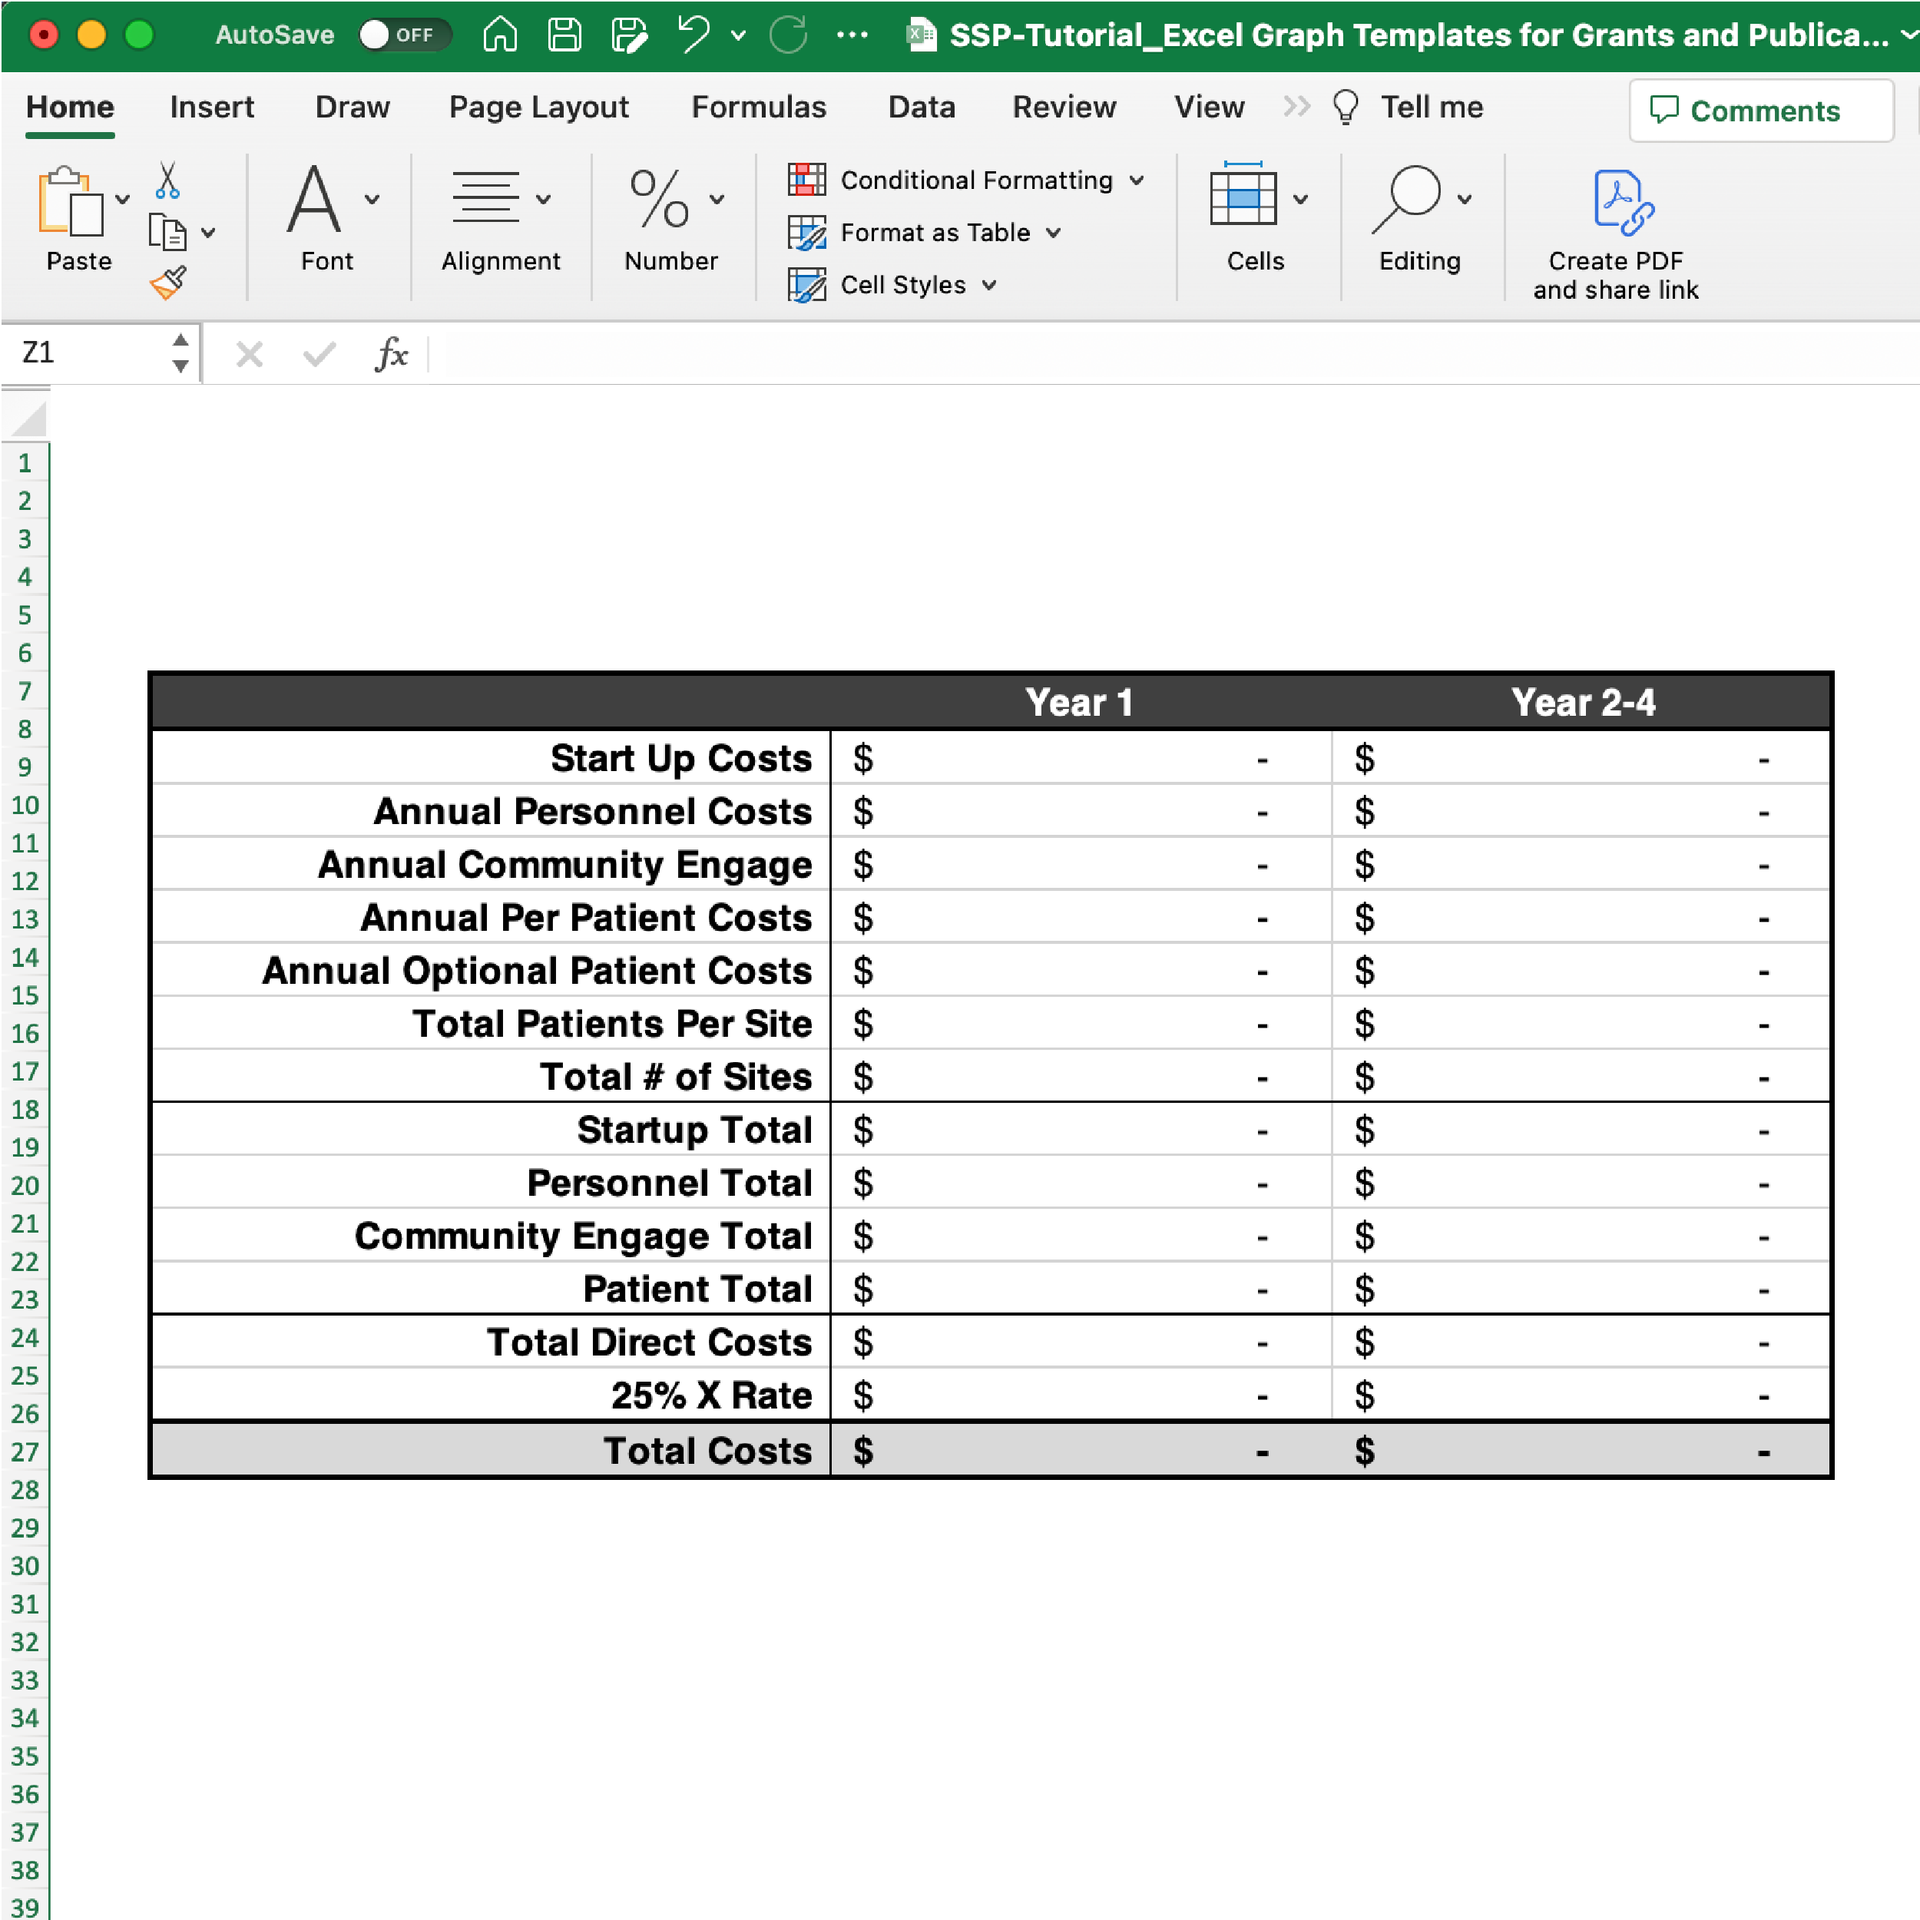
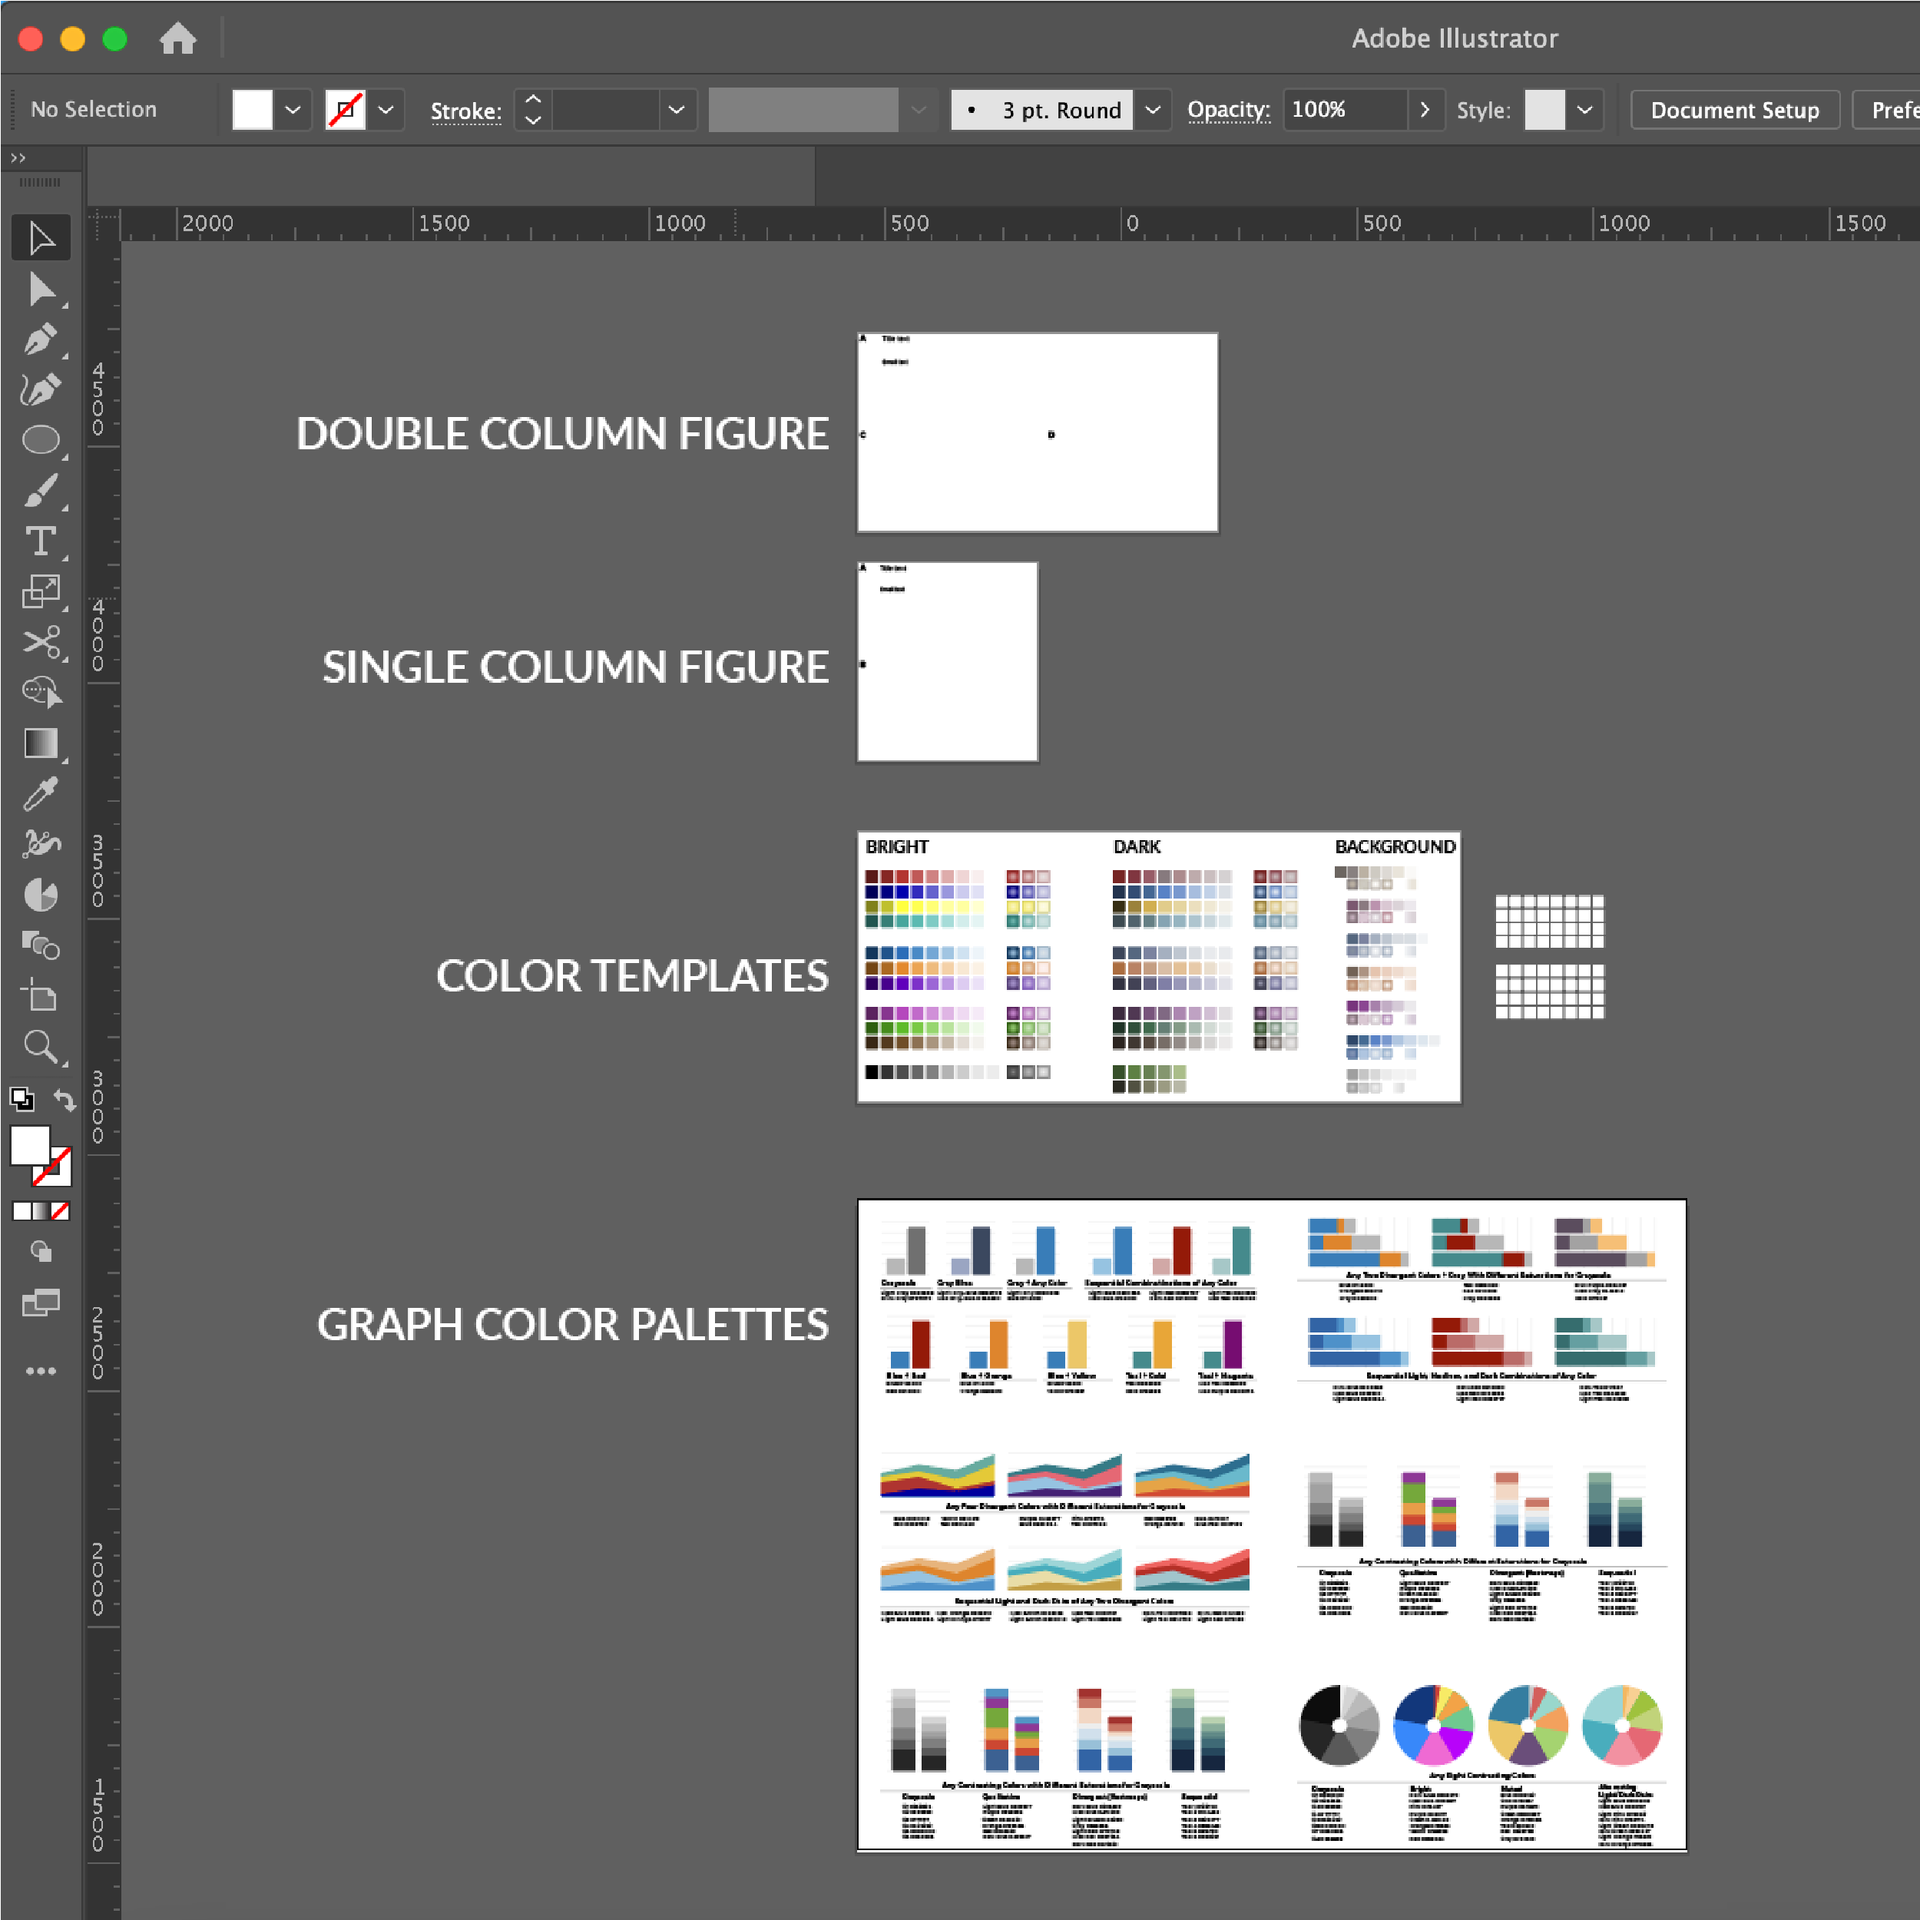
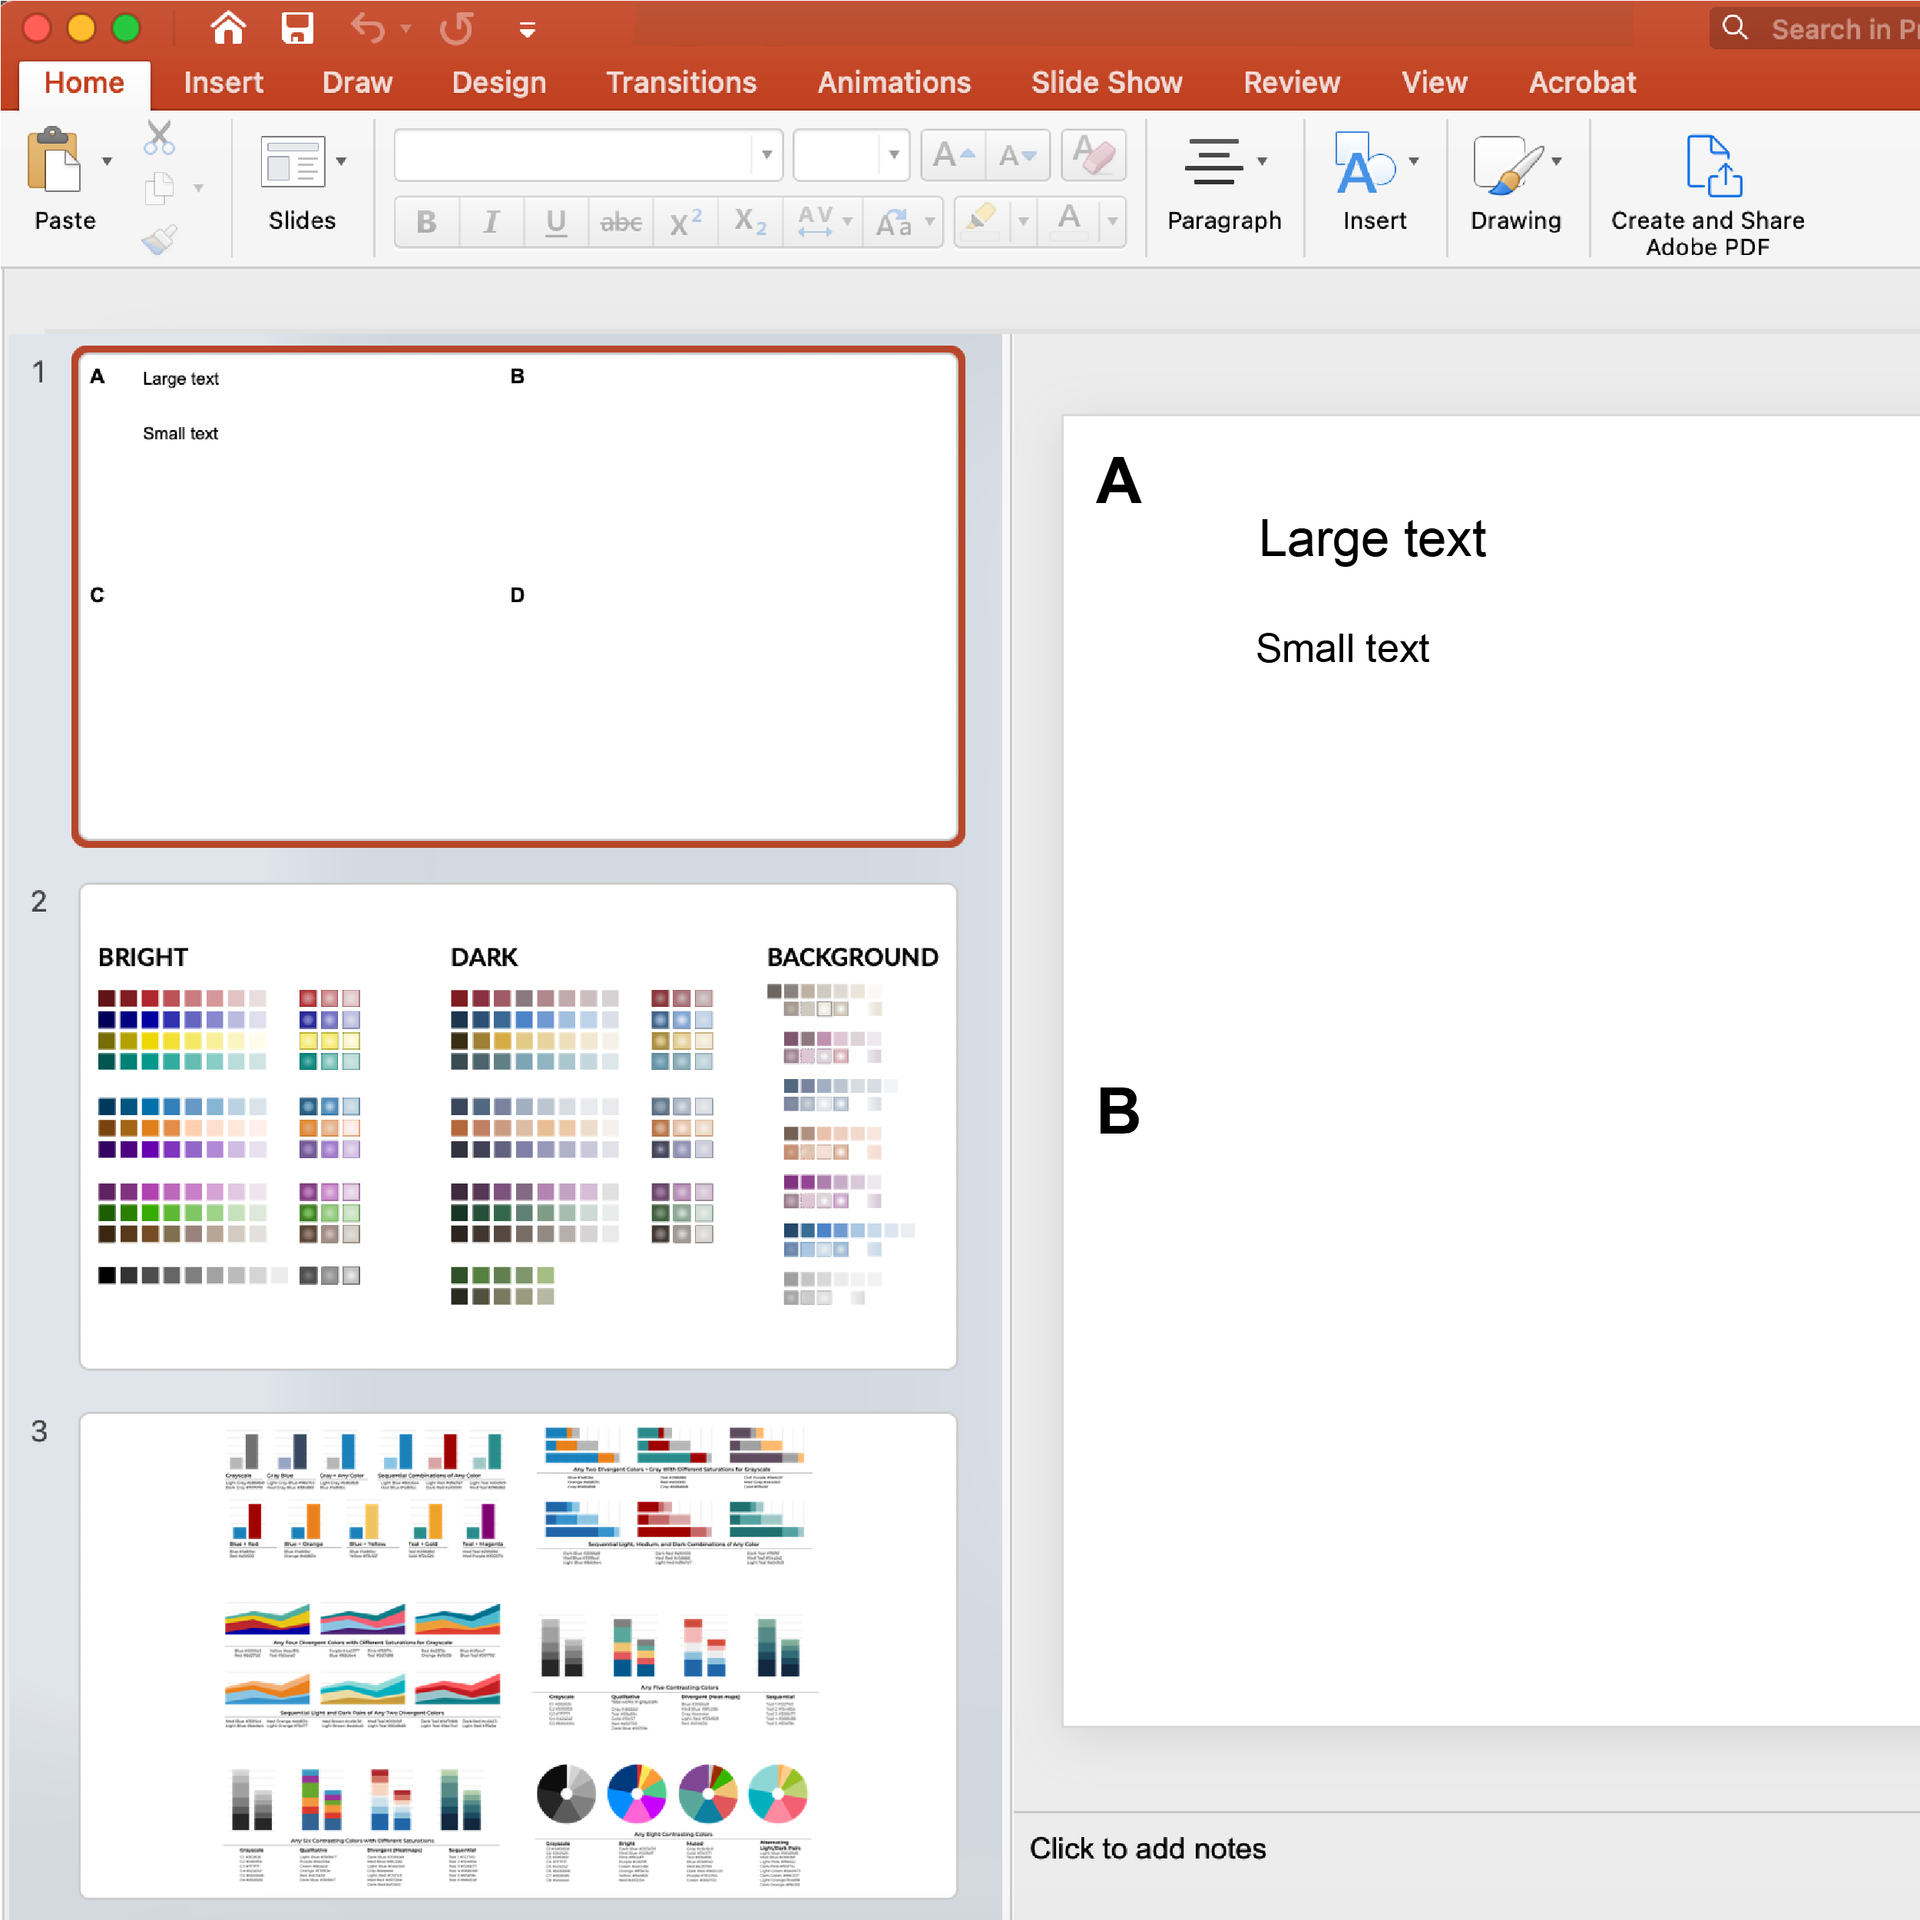
The excel graph and table templates are designed to make it easy for you to create professional data visualizations. Graph template options include bar charts, line graphs, box and whisker plots, and pie charts. The table template has options for scientific publications, summary tables, as well as grant cost and milestone tables.
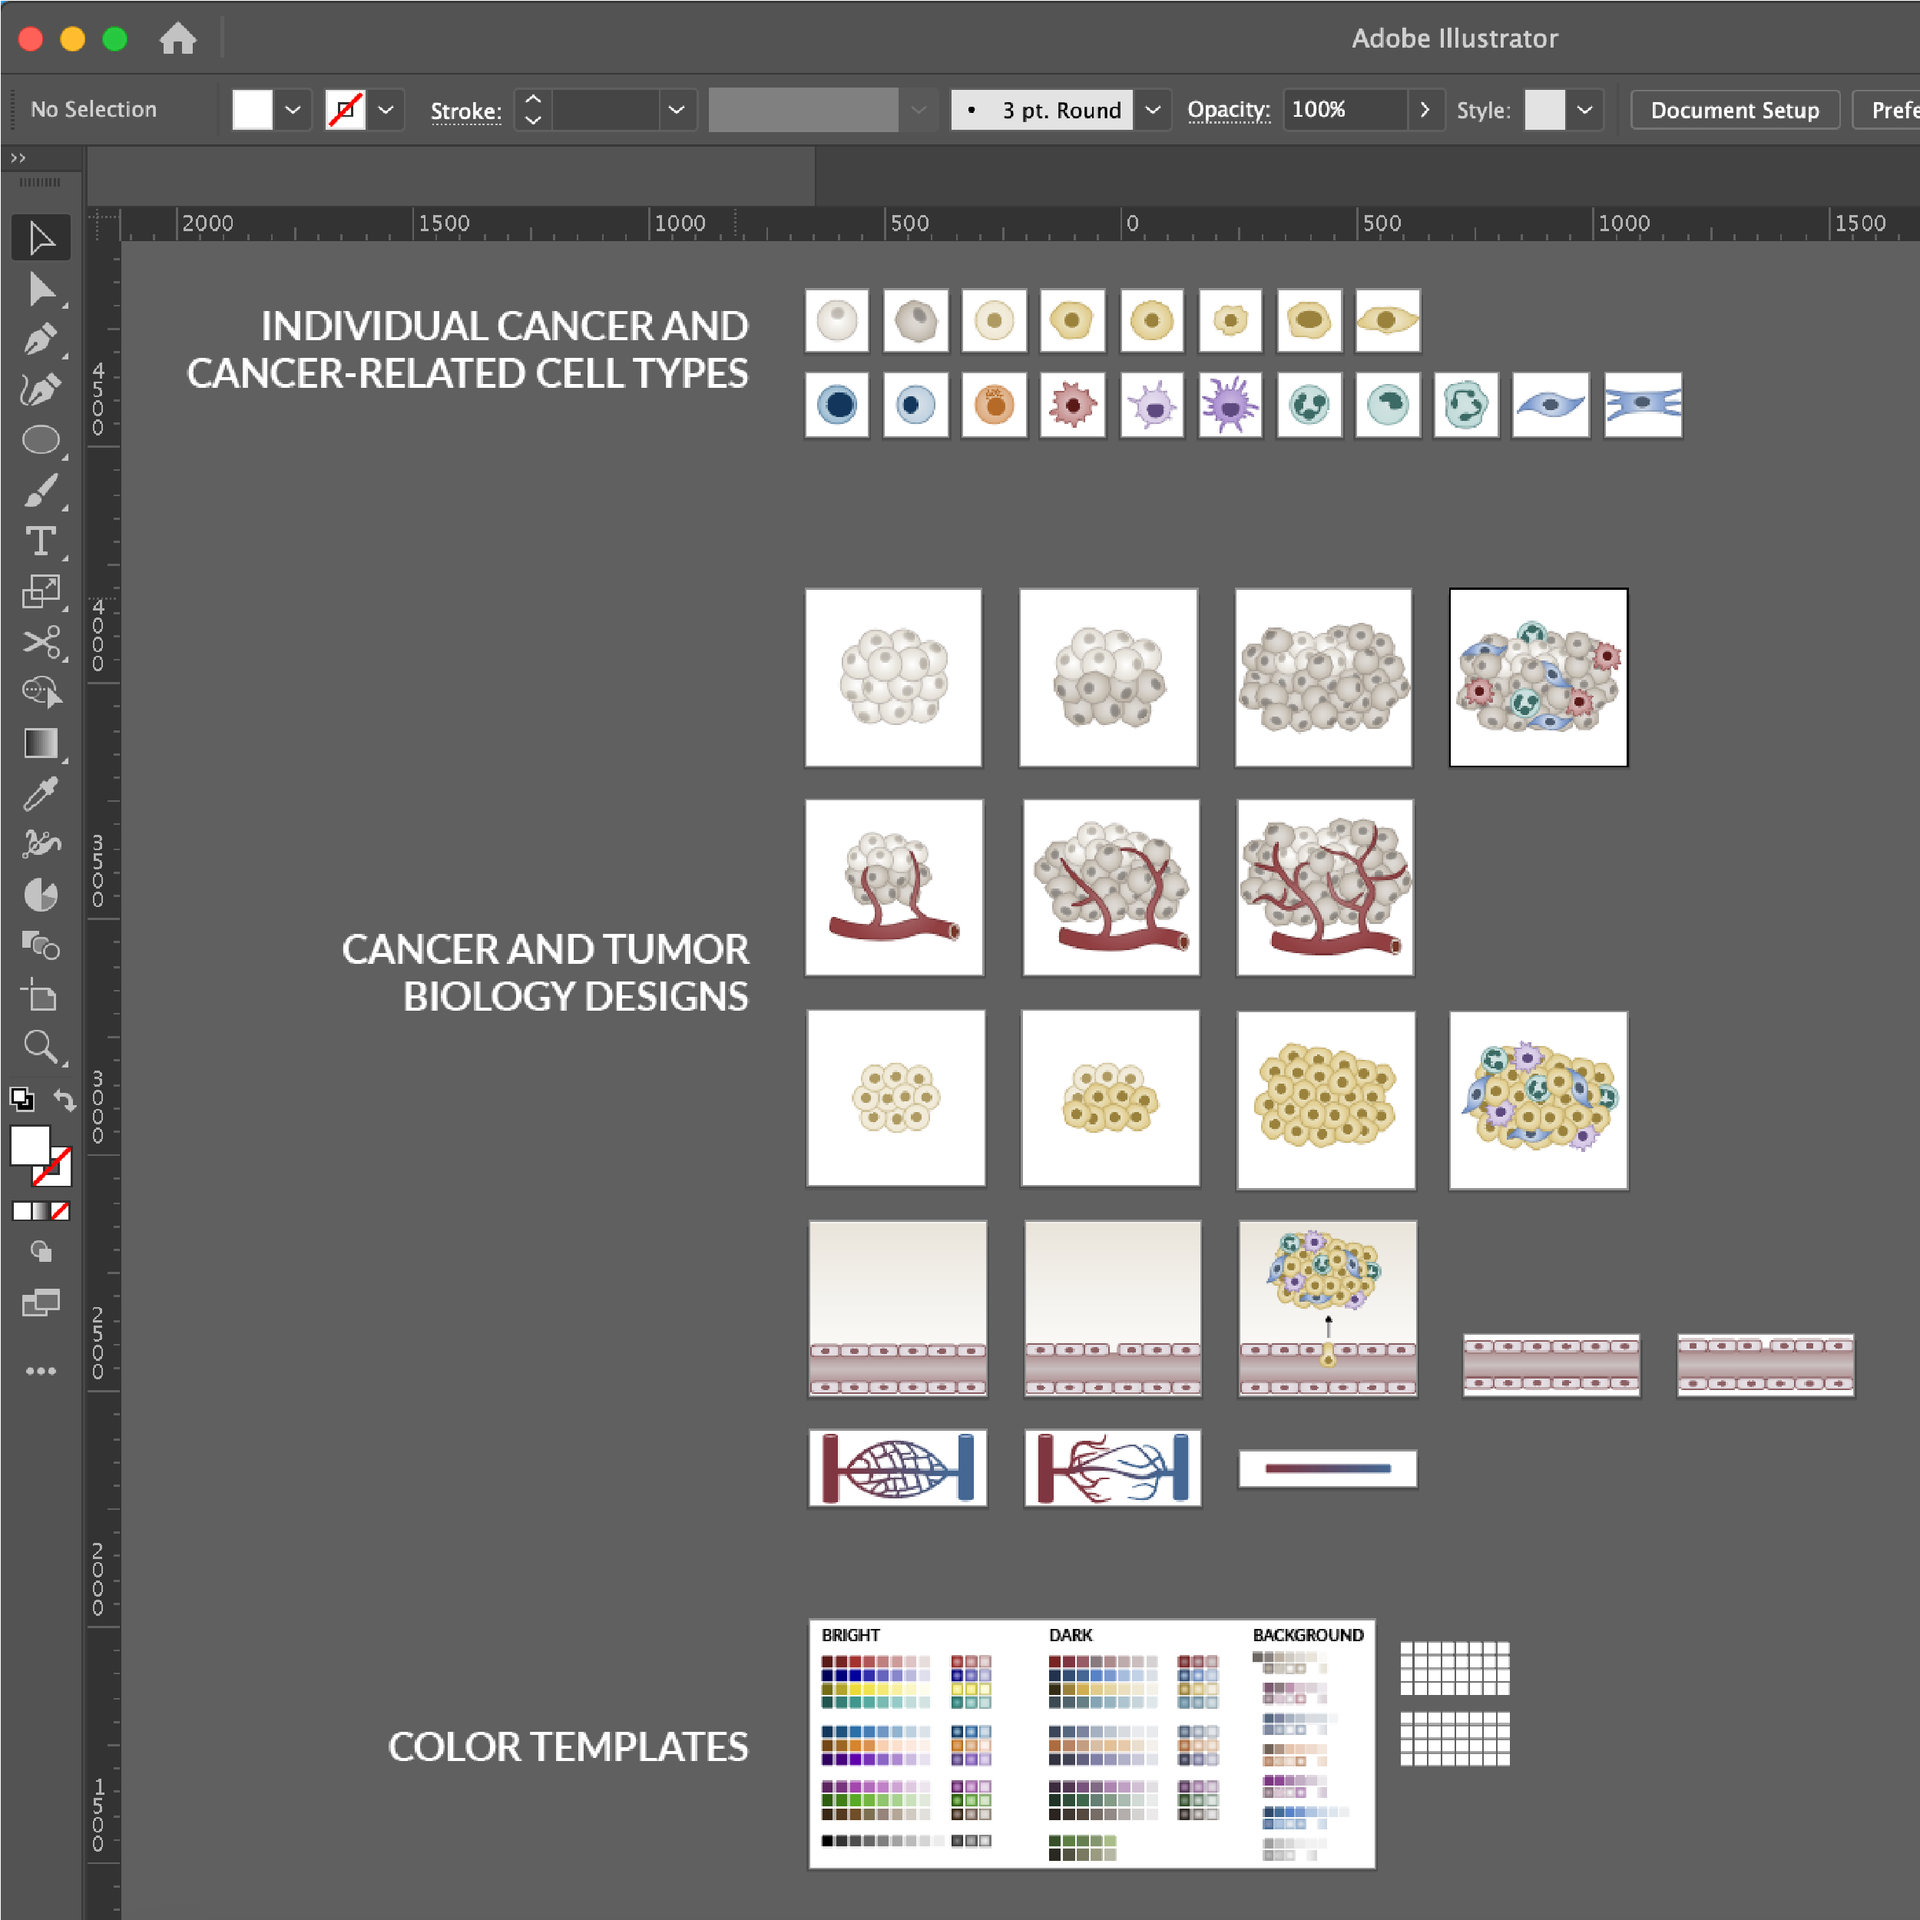
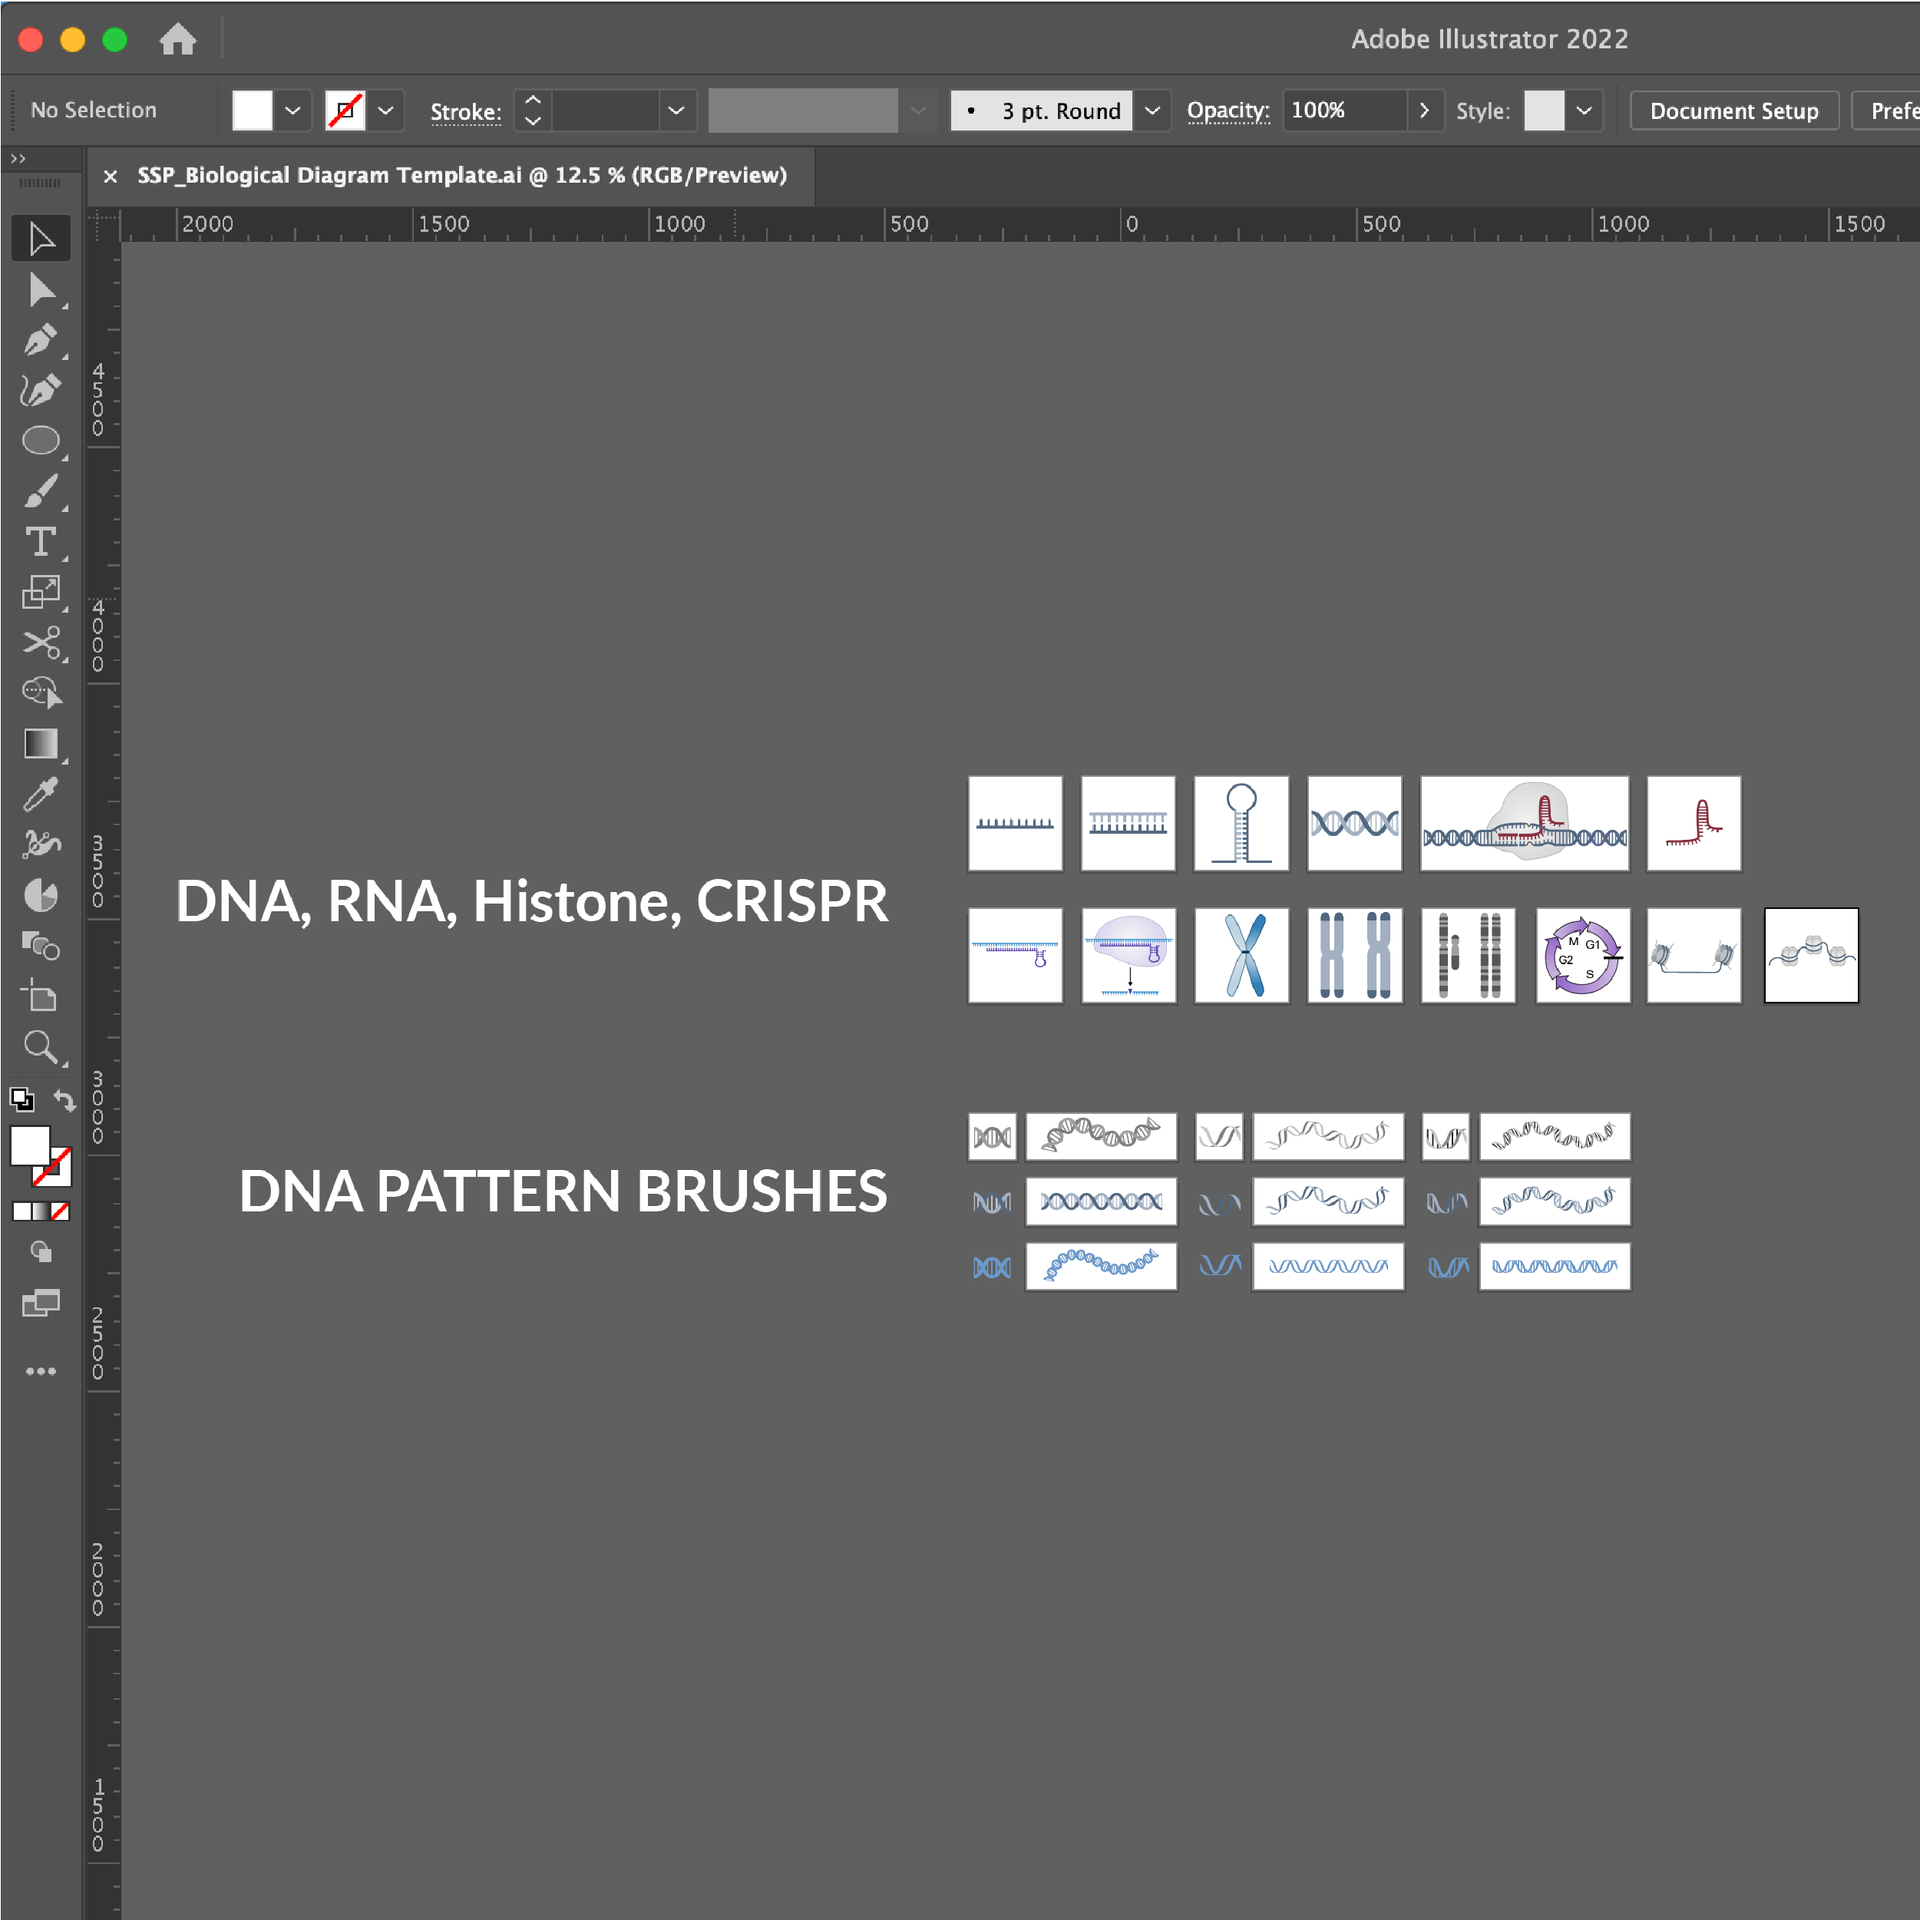
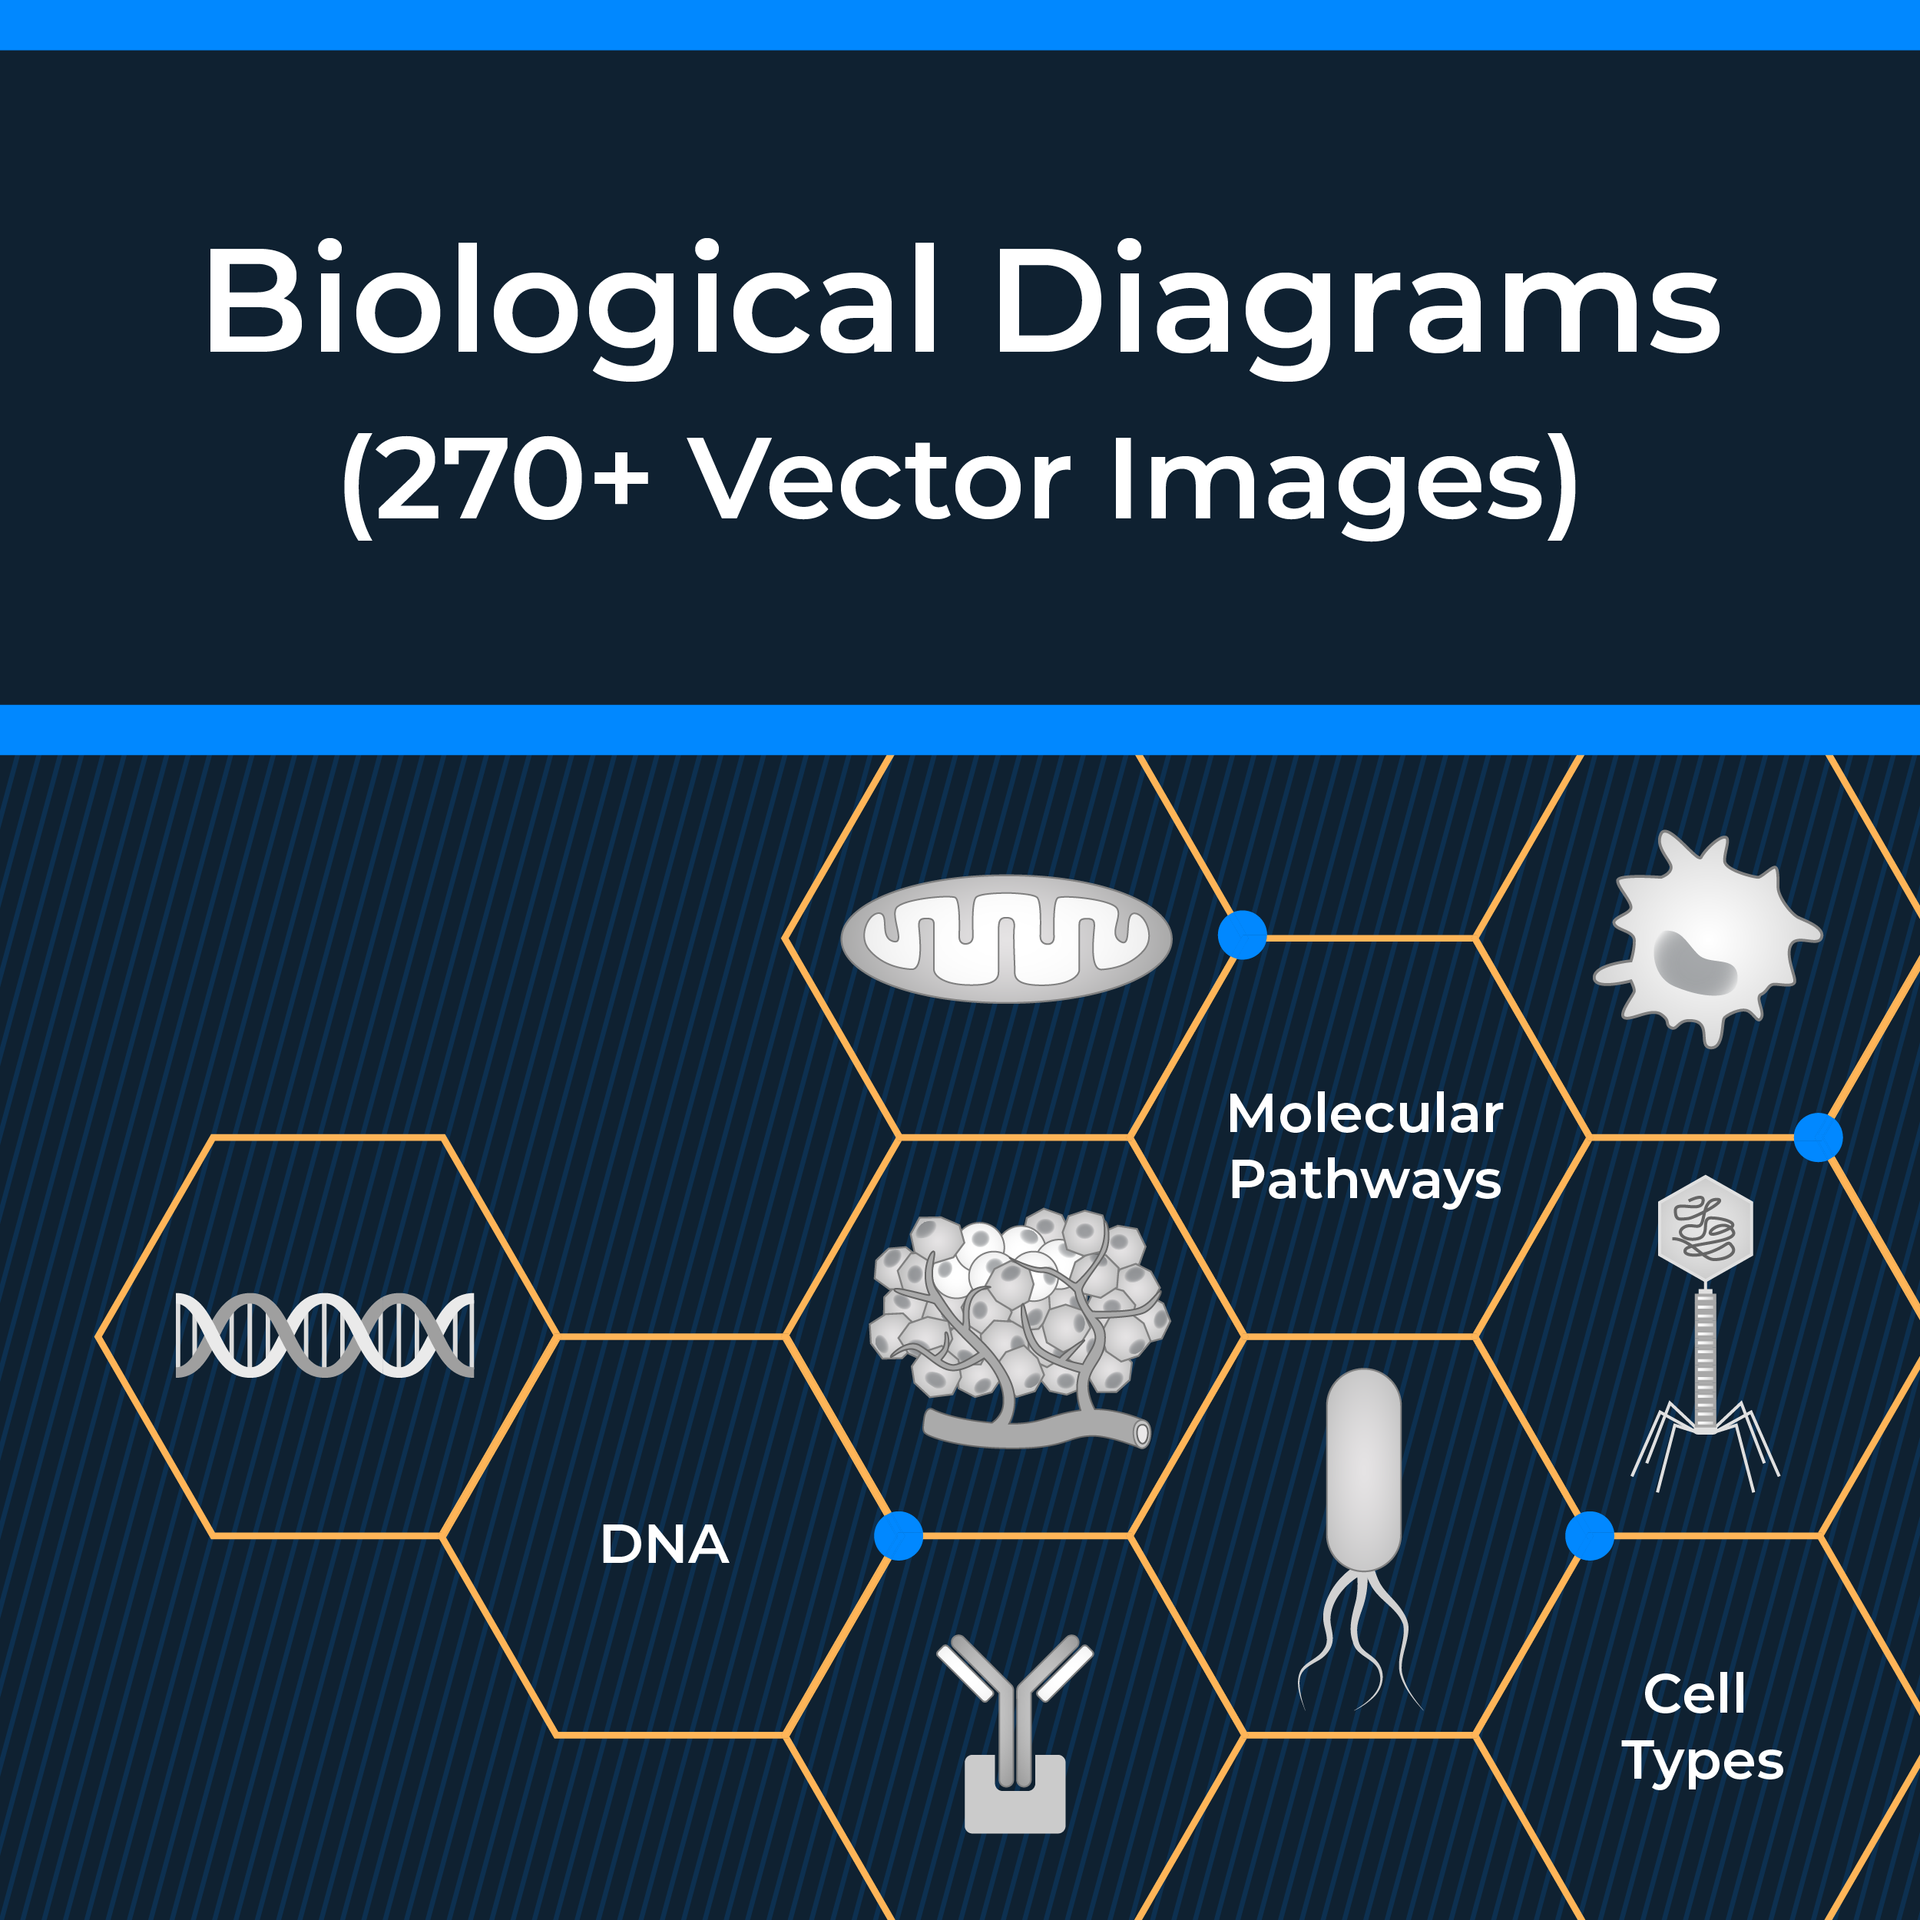
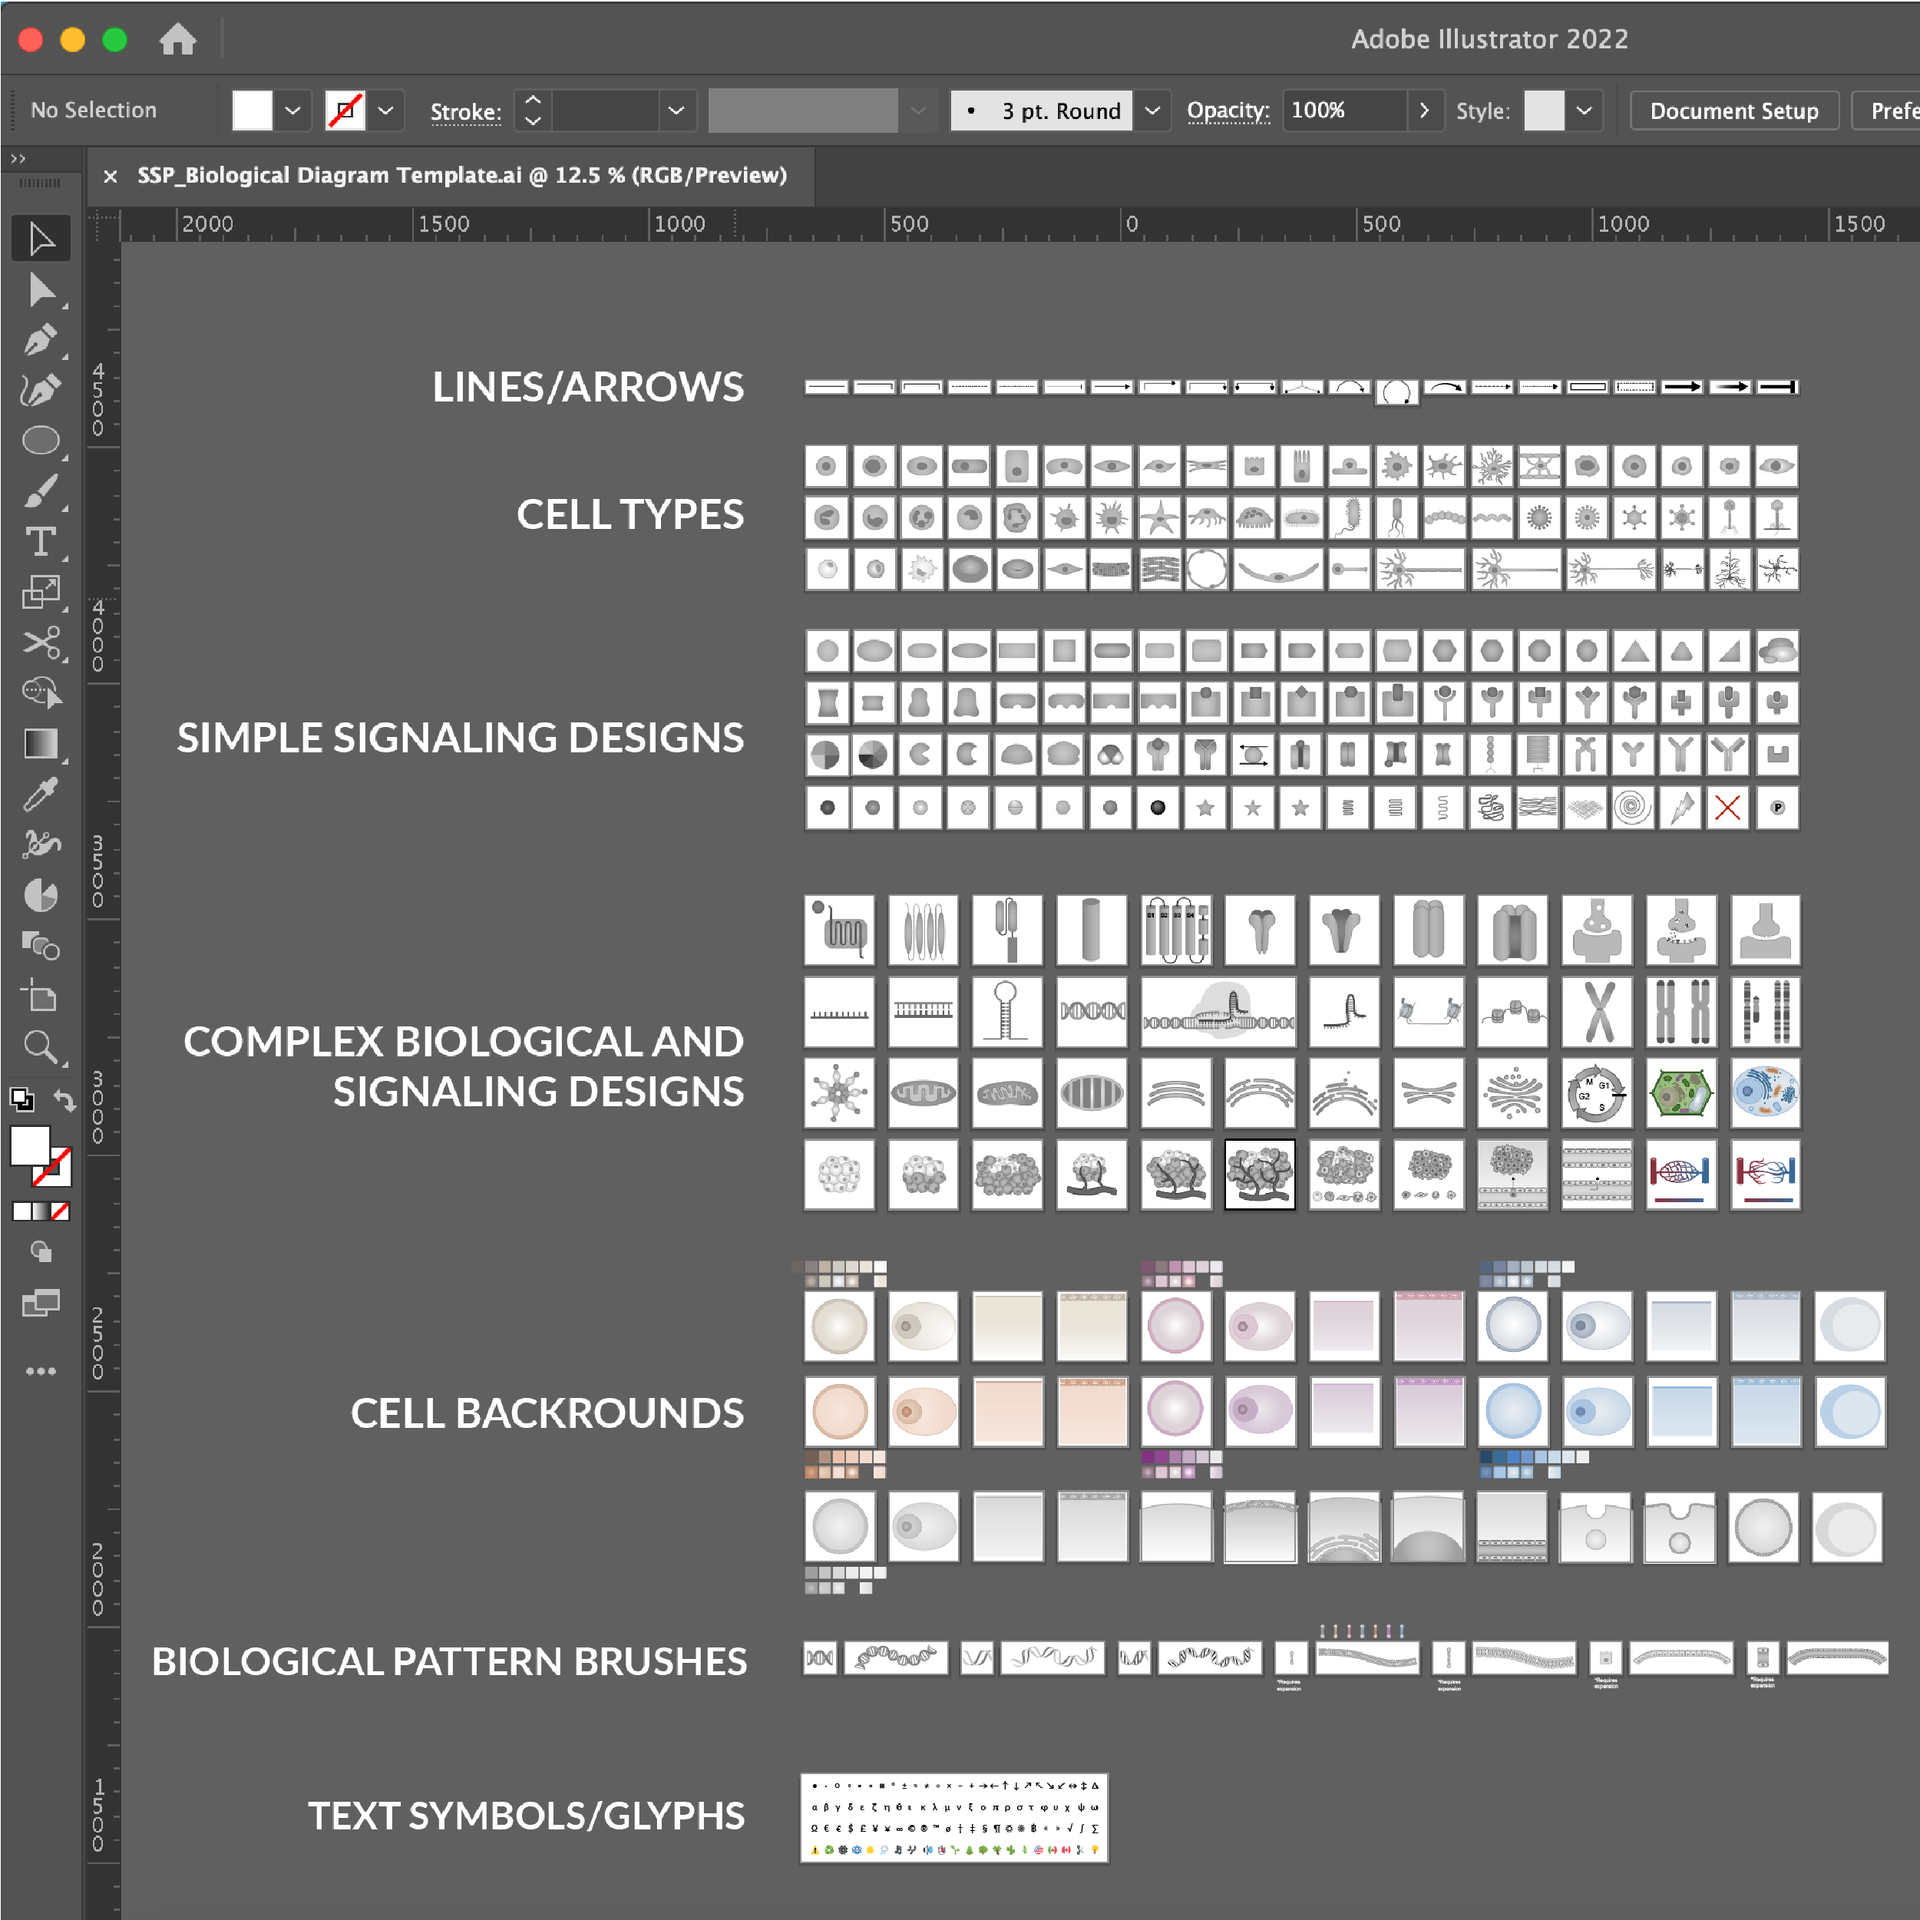
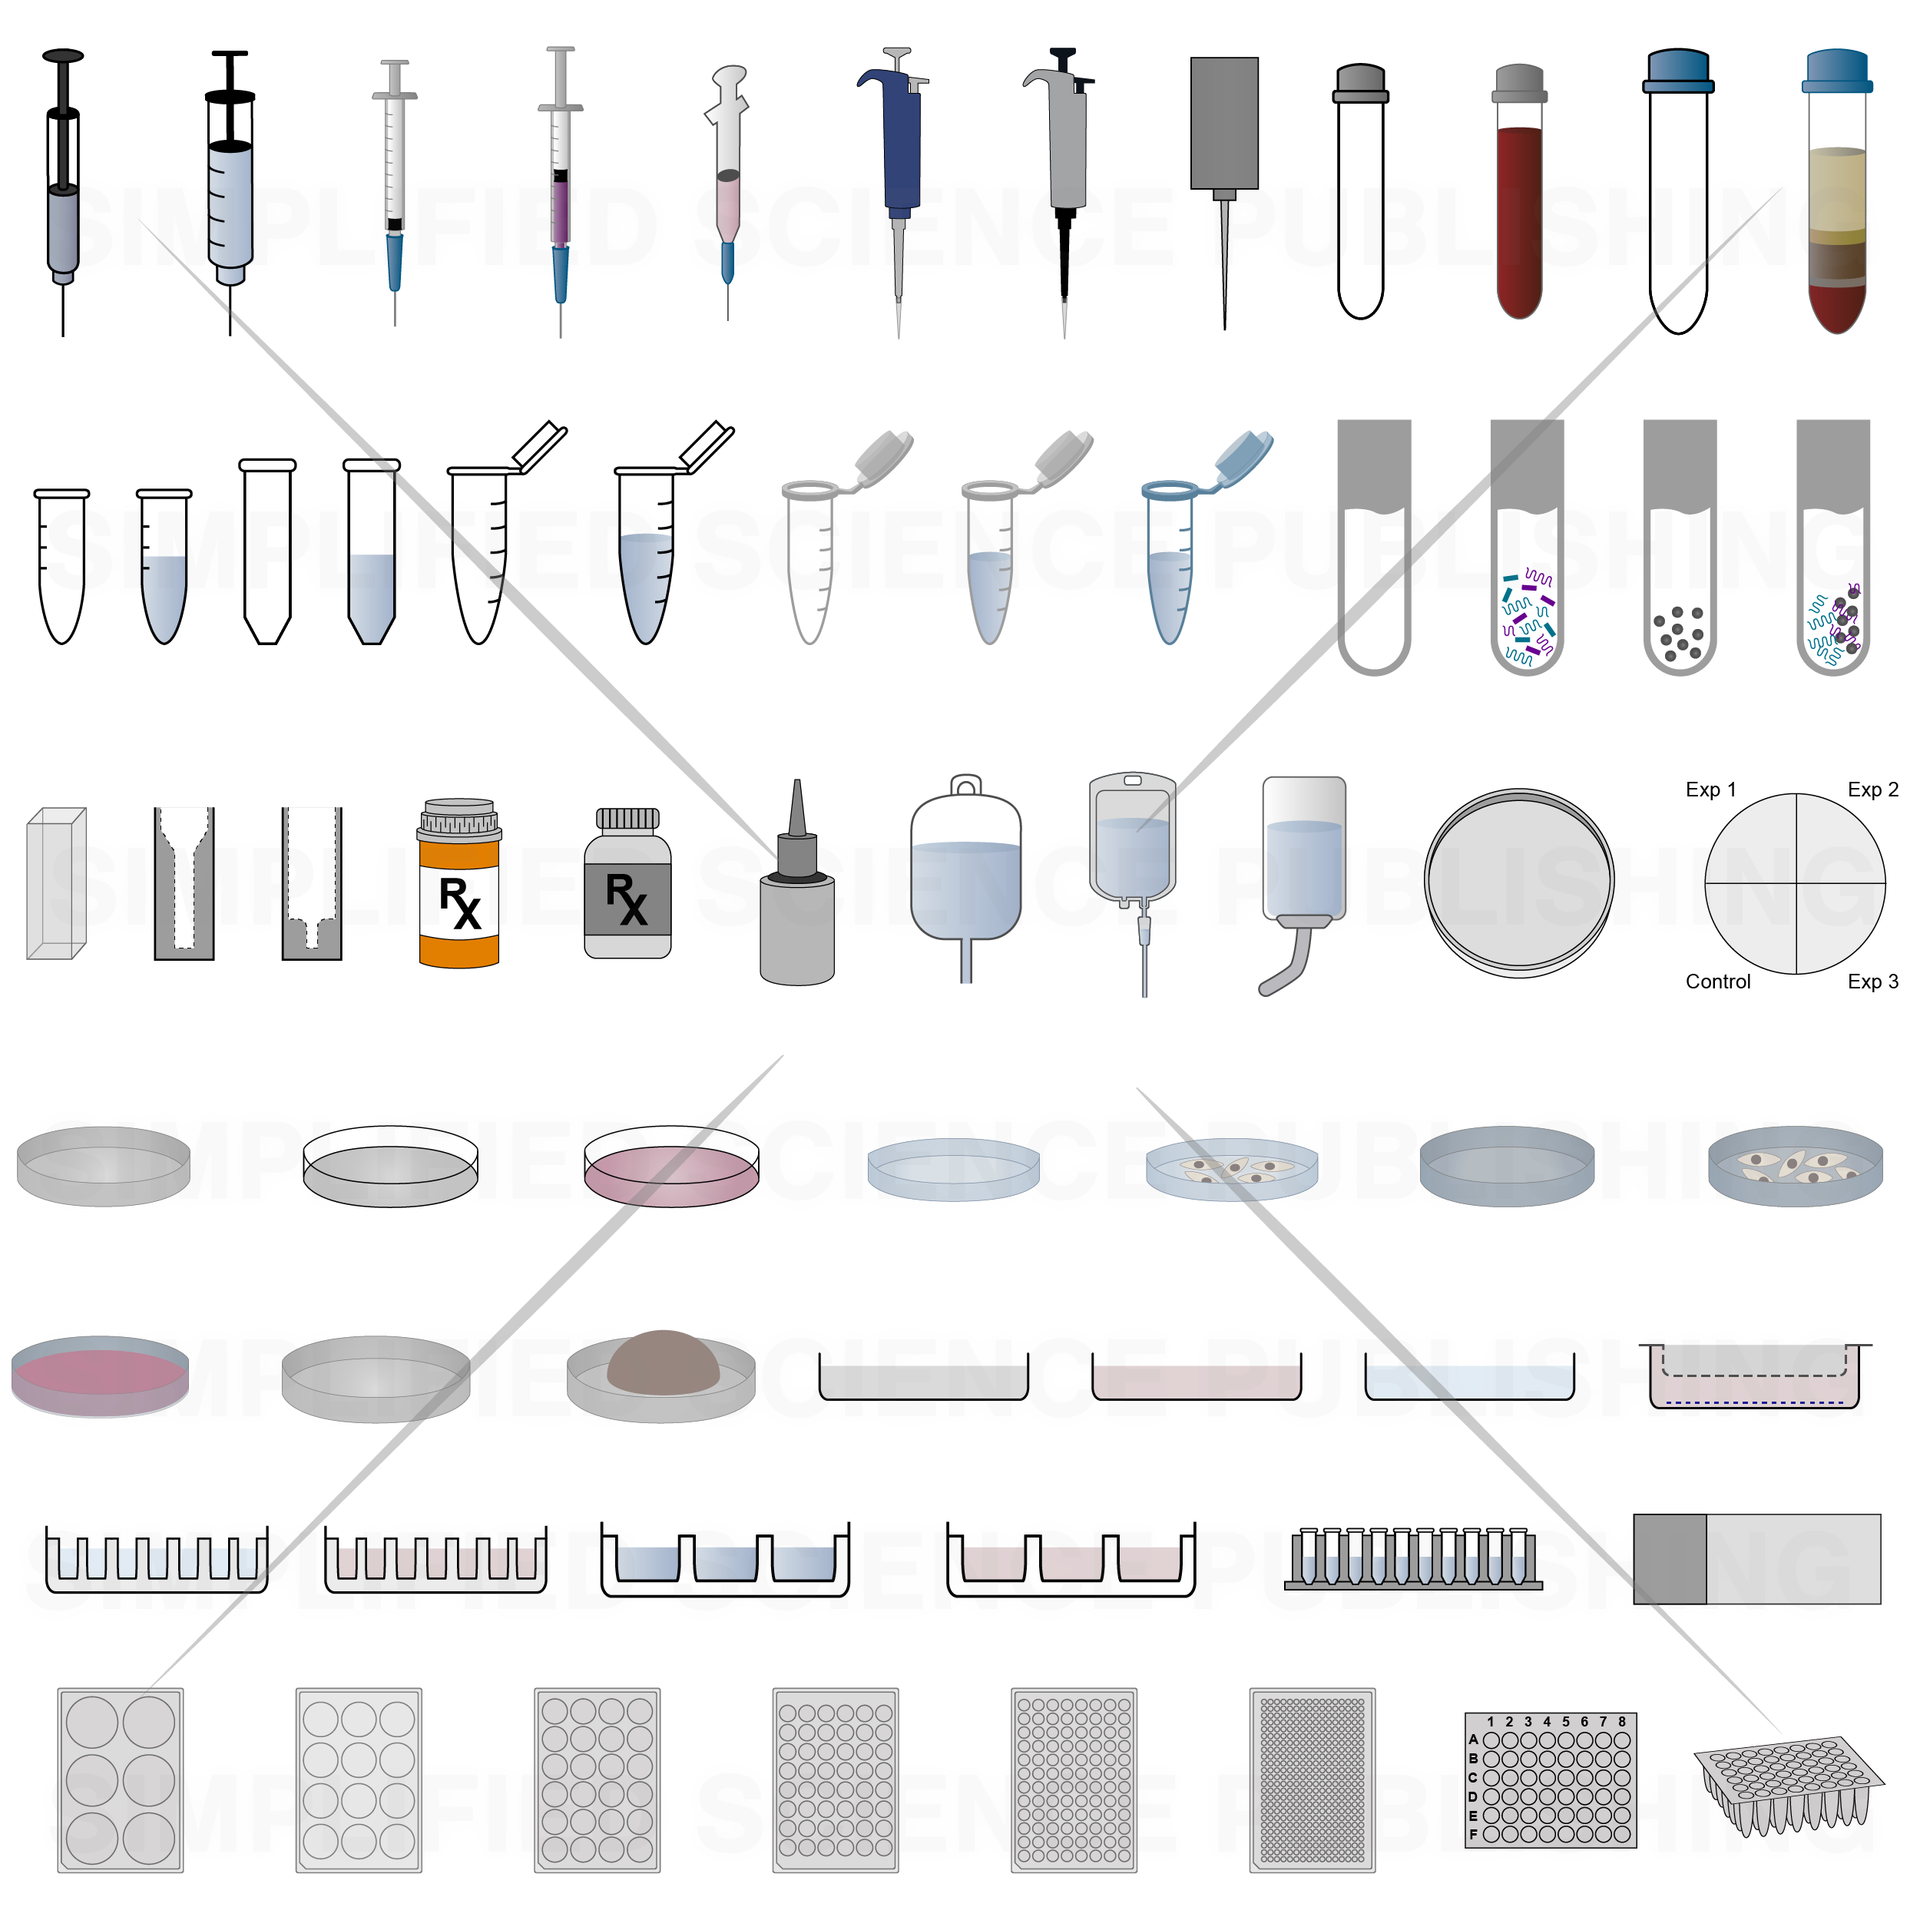
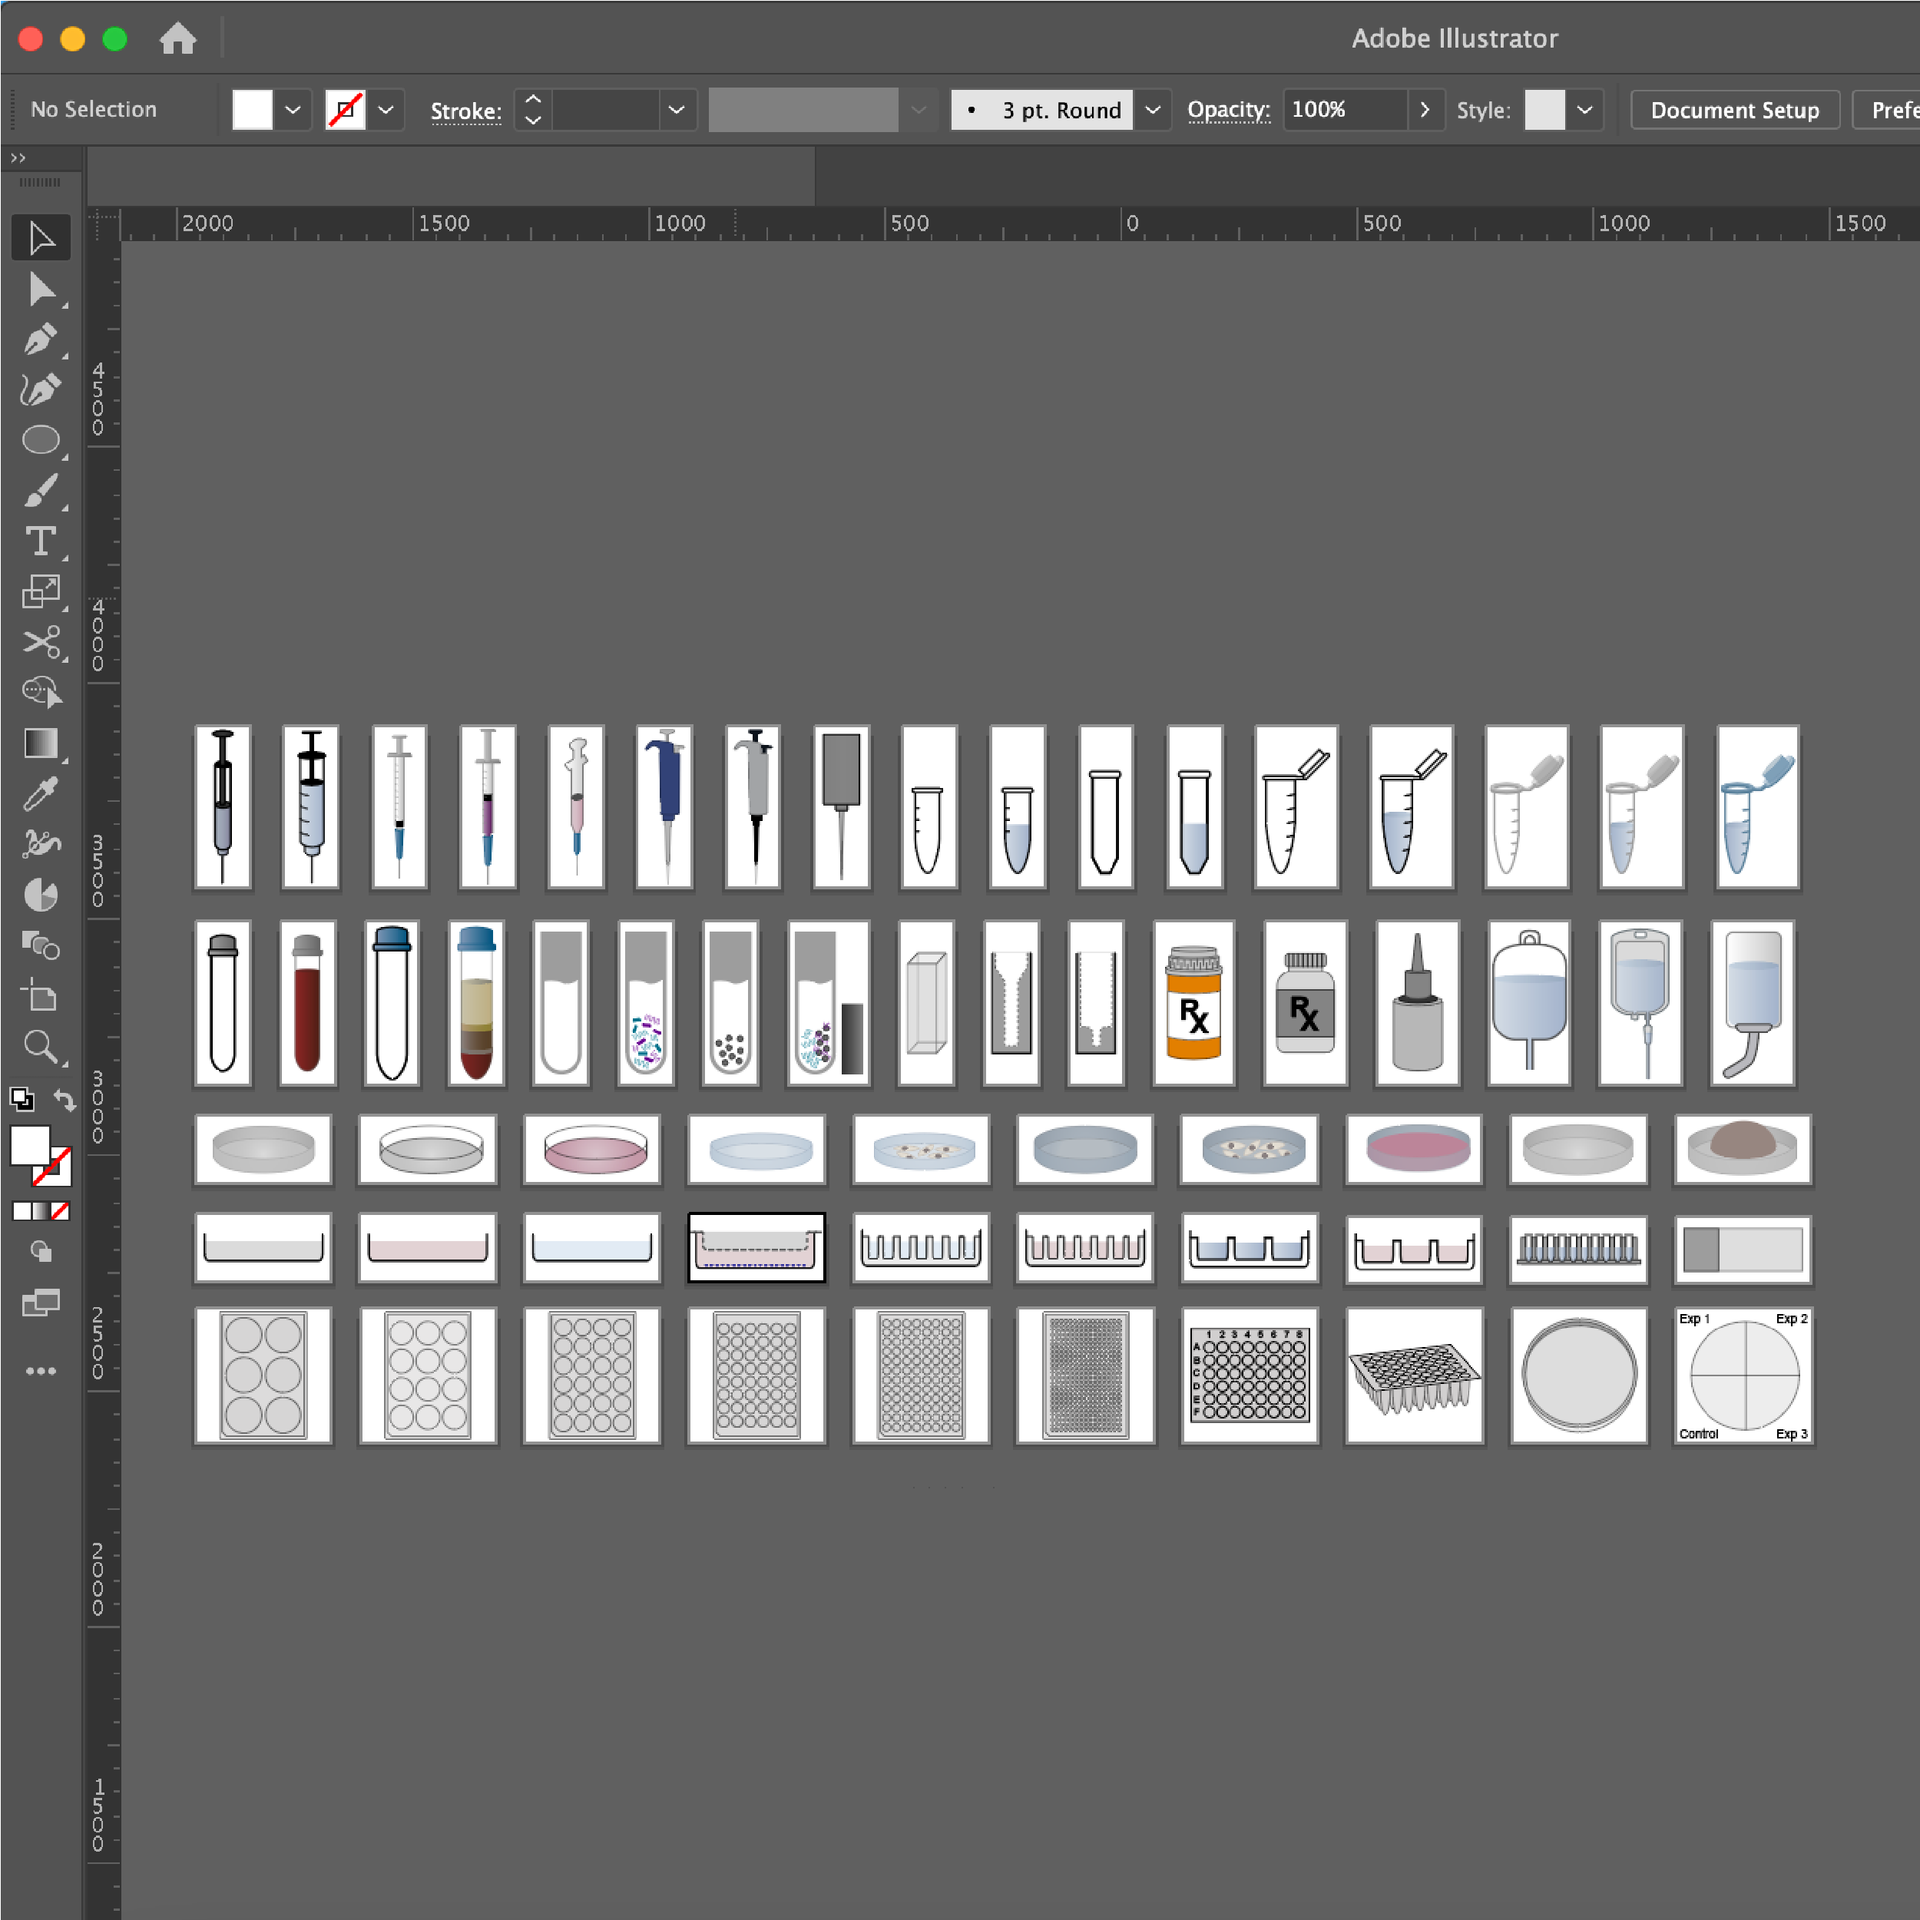
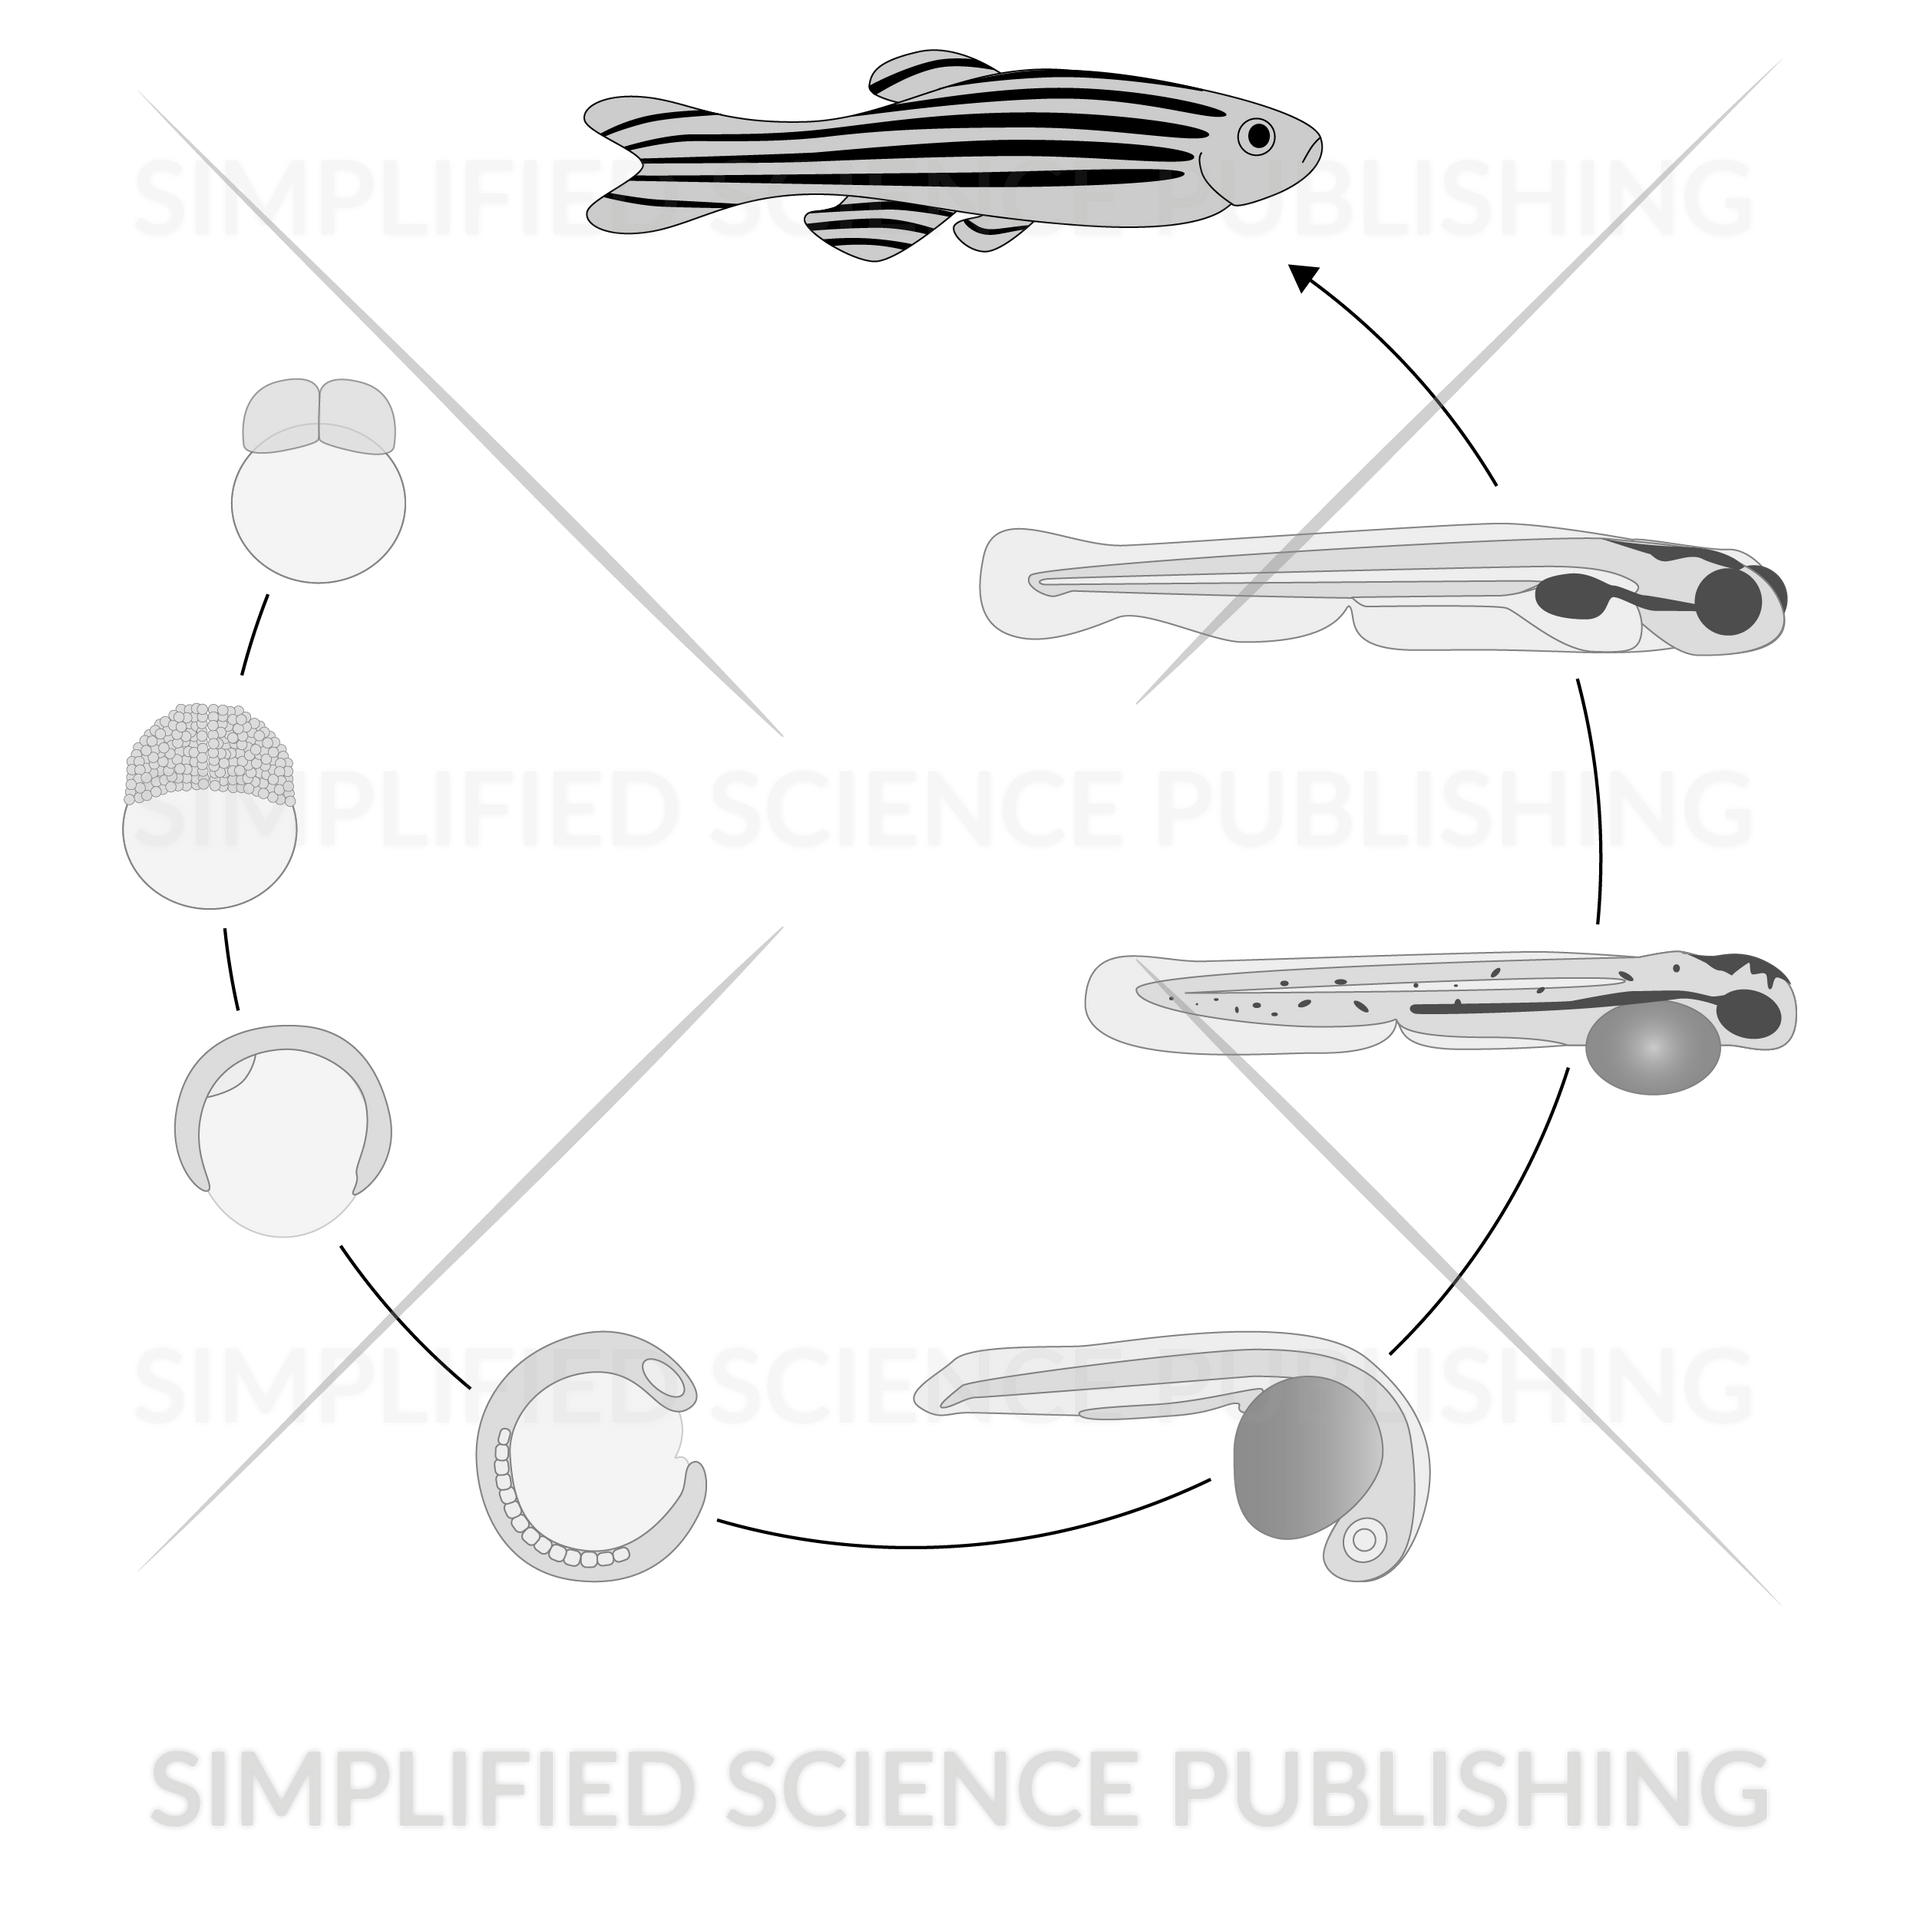
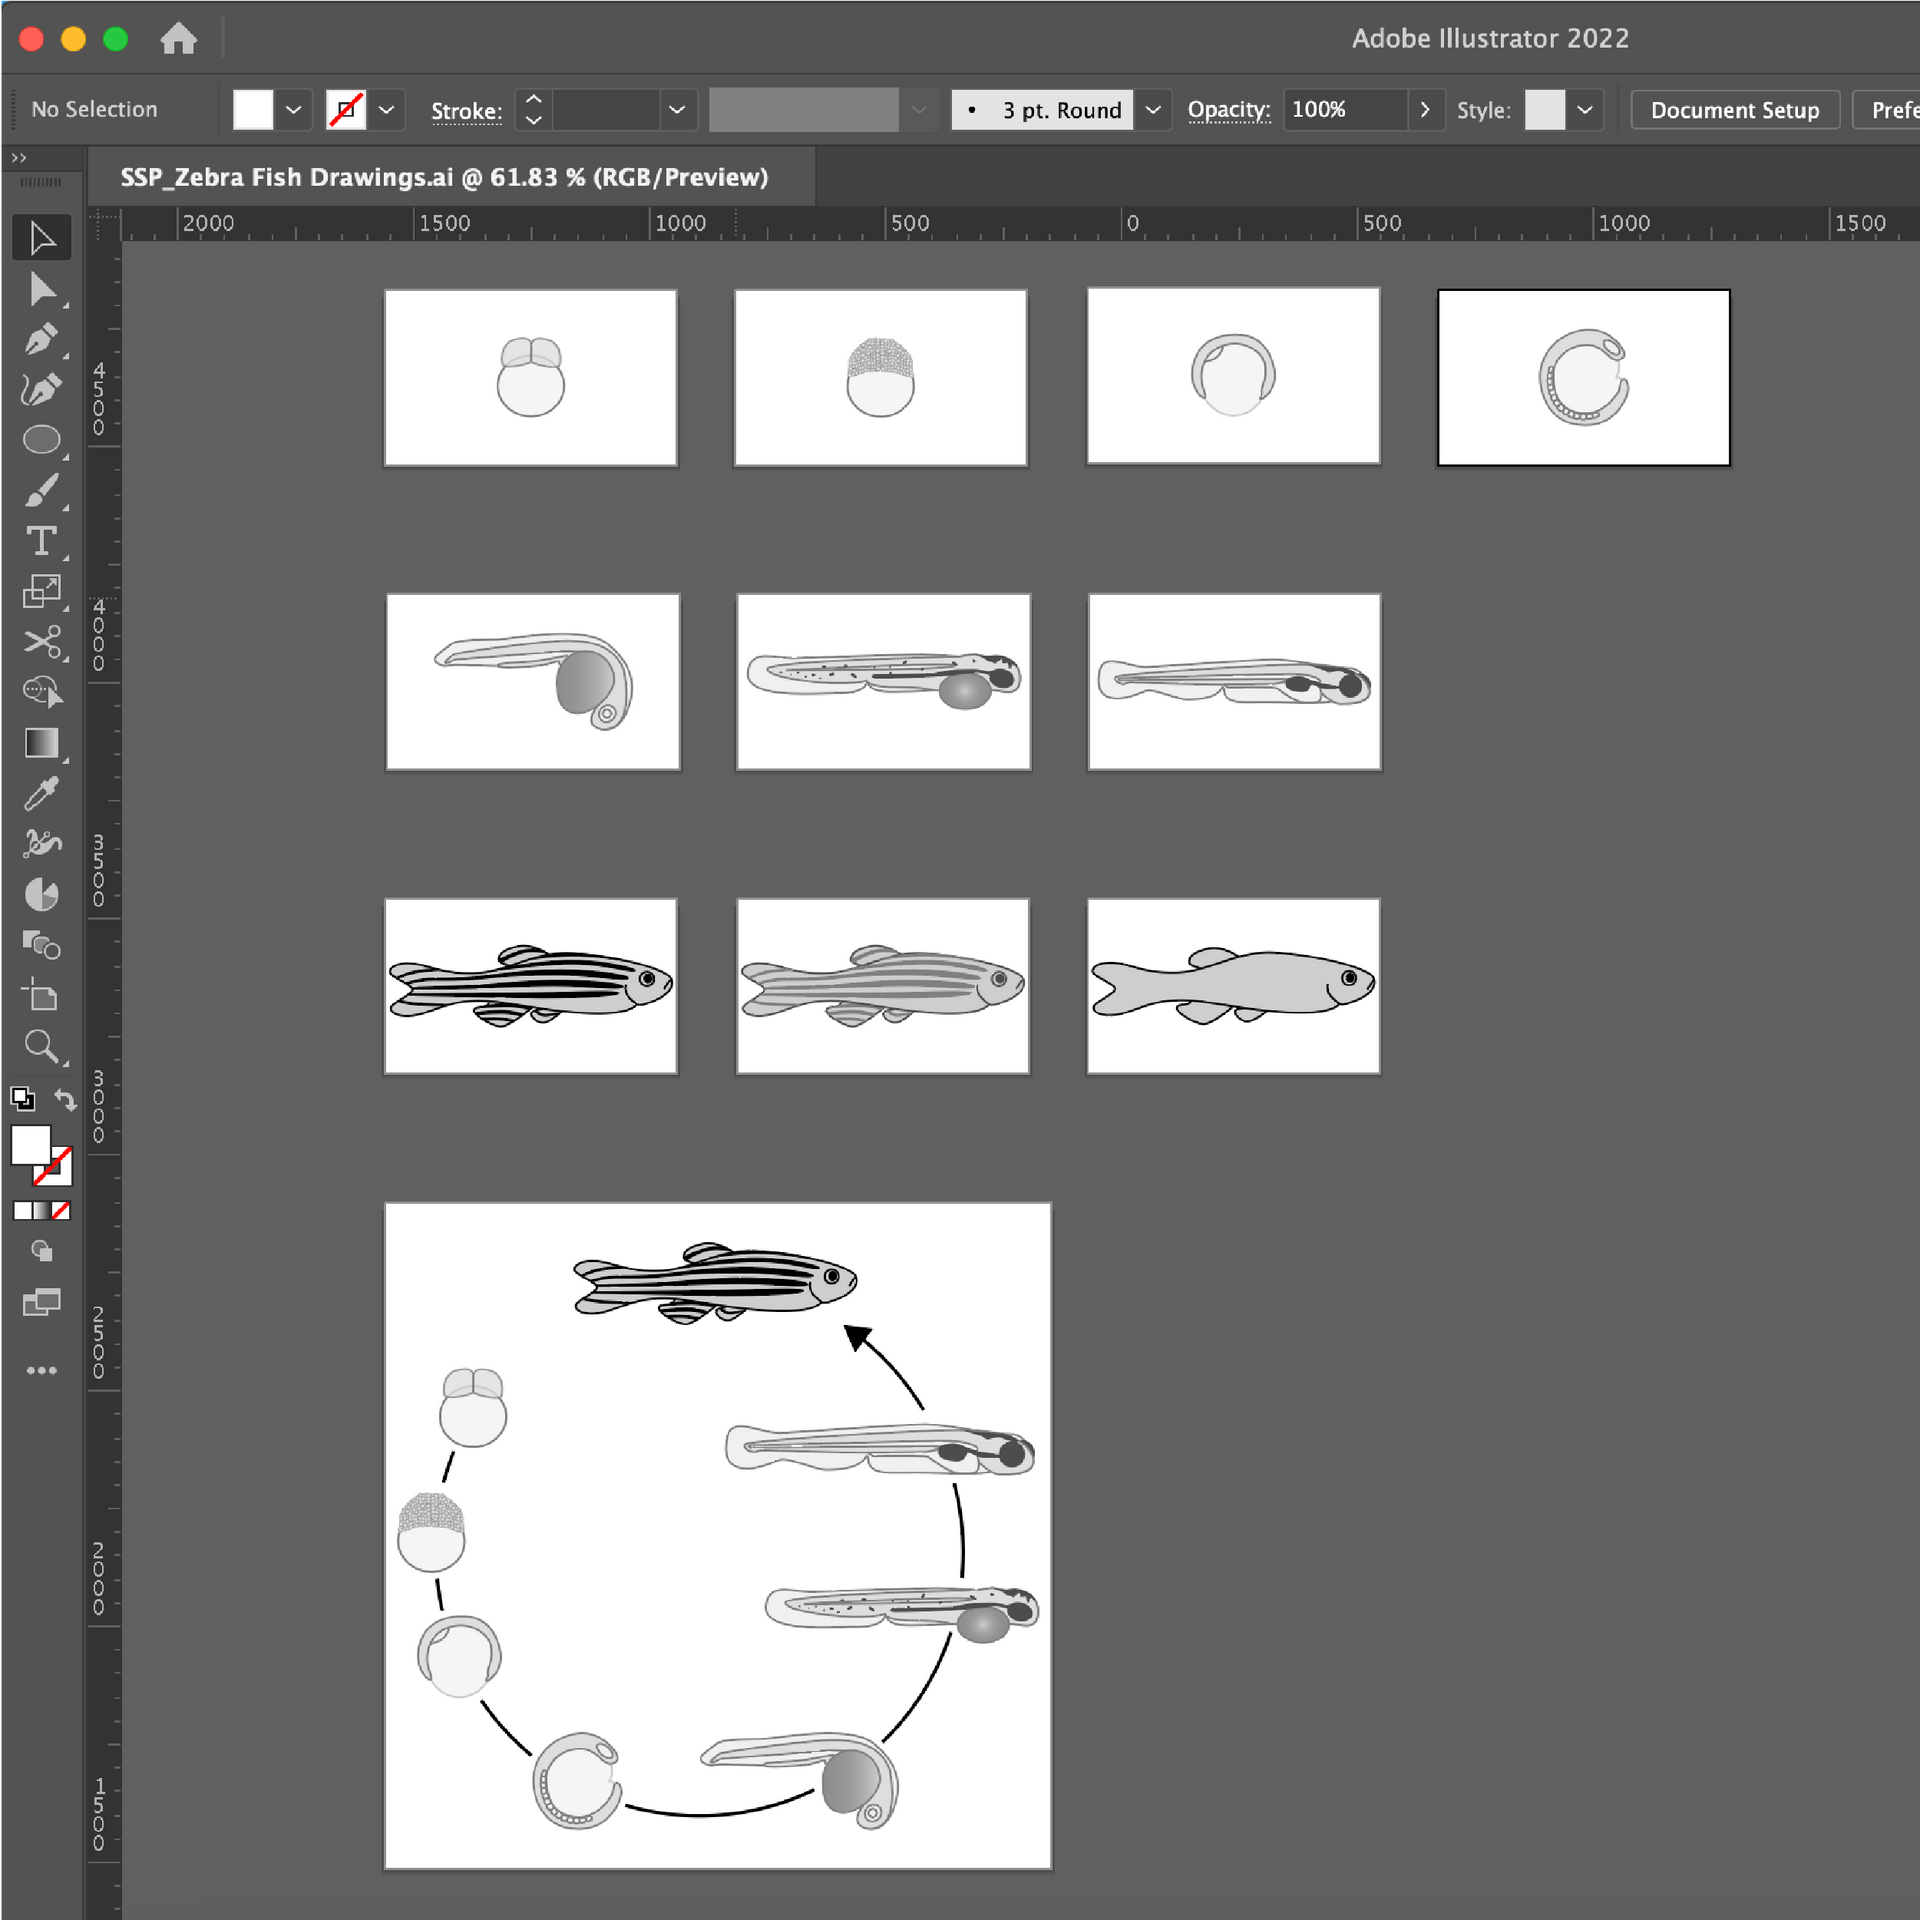
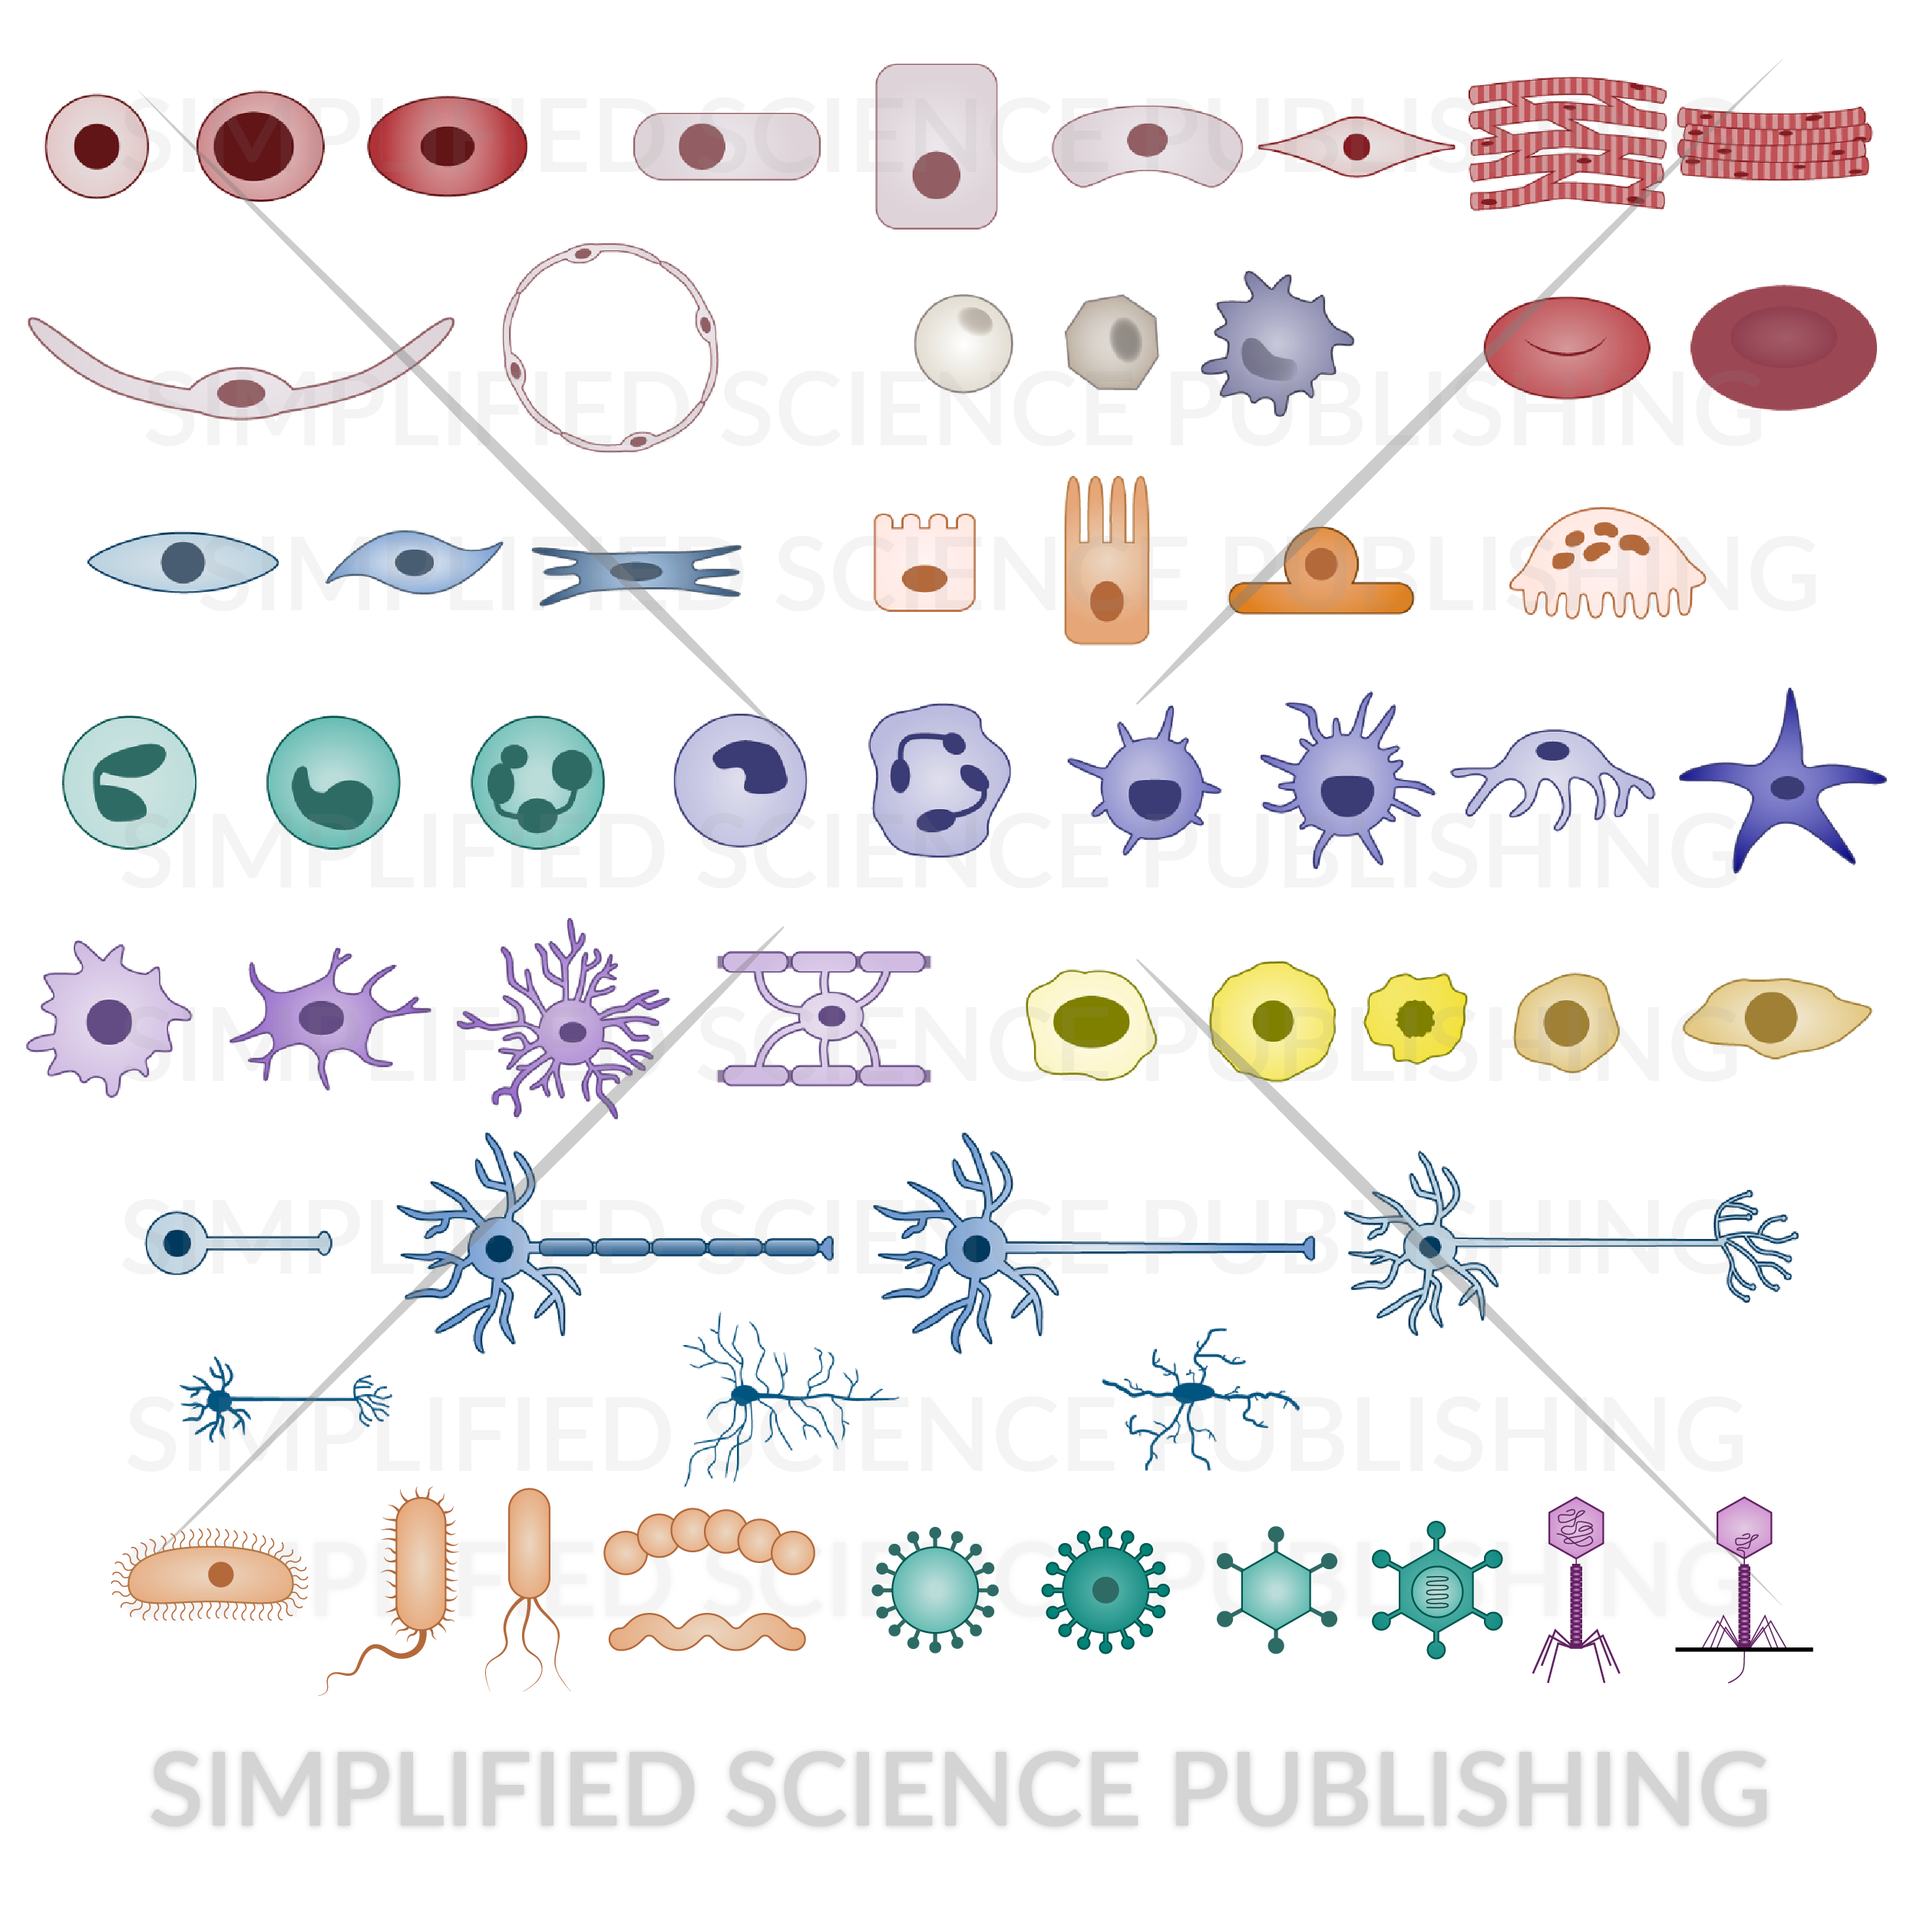
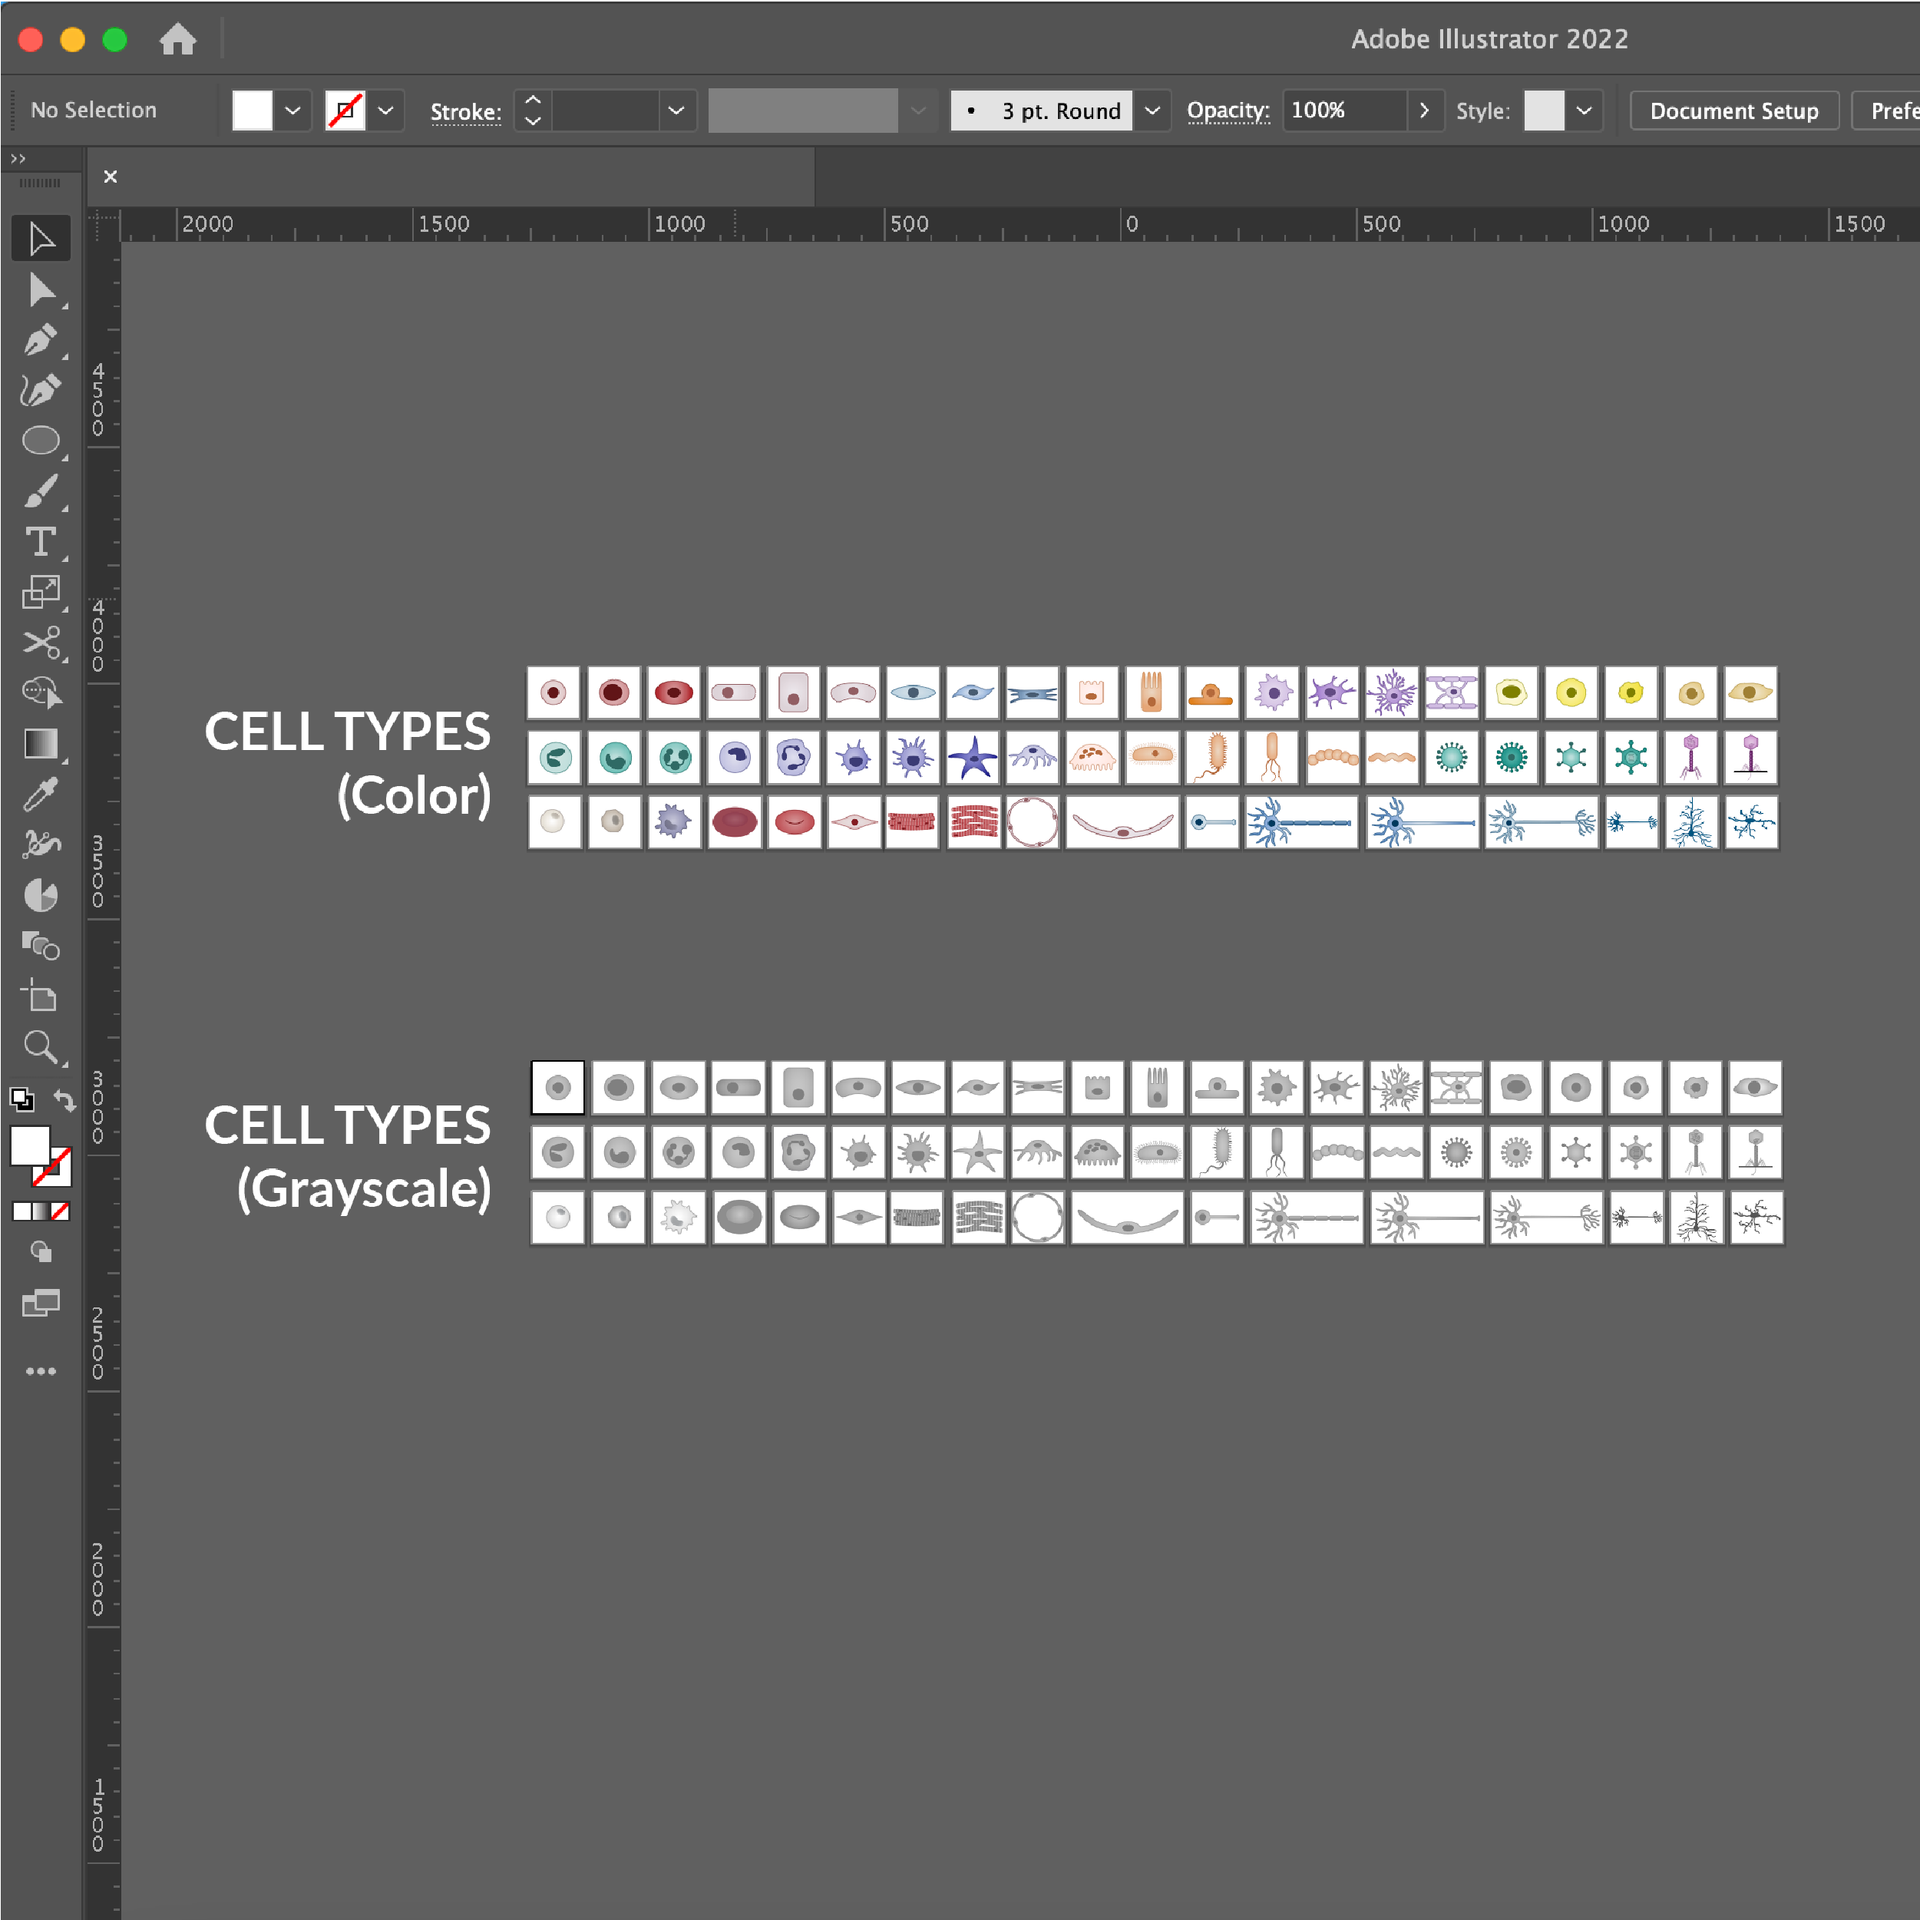
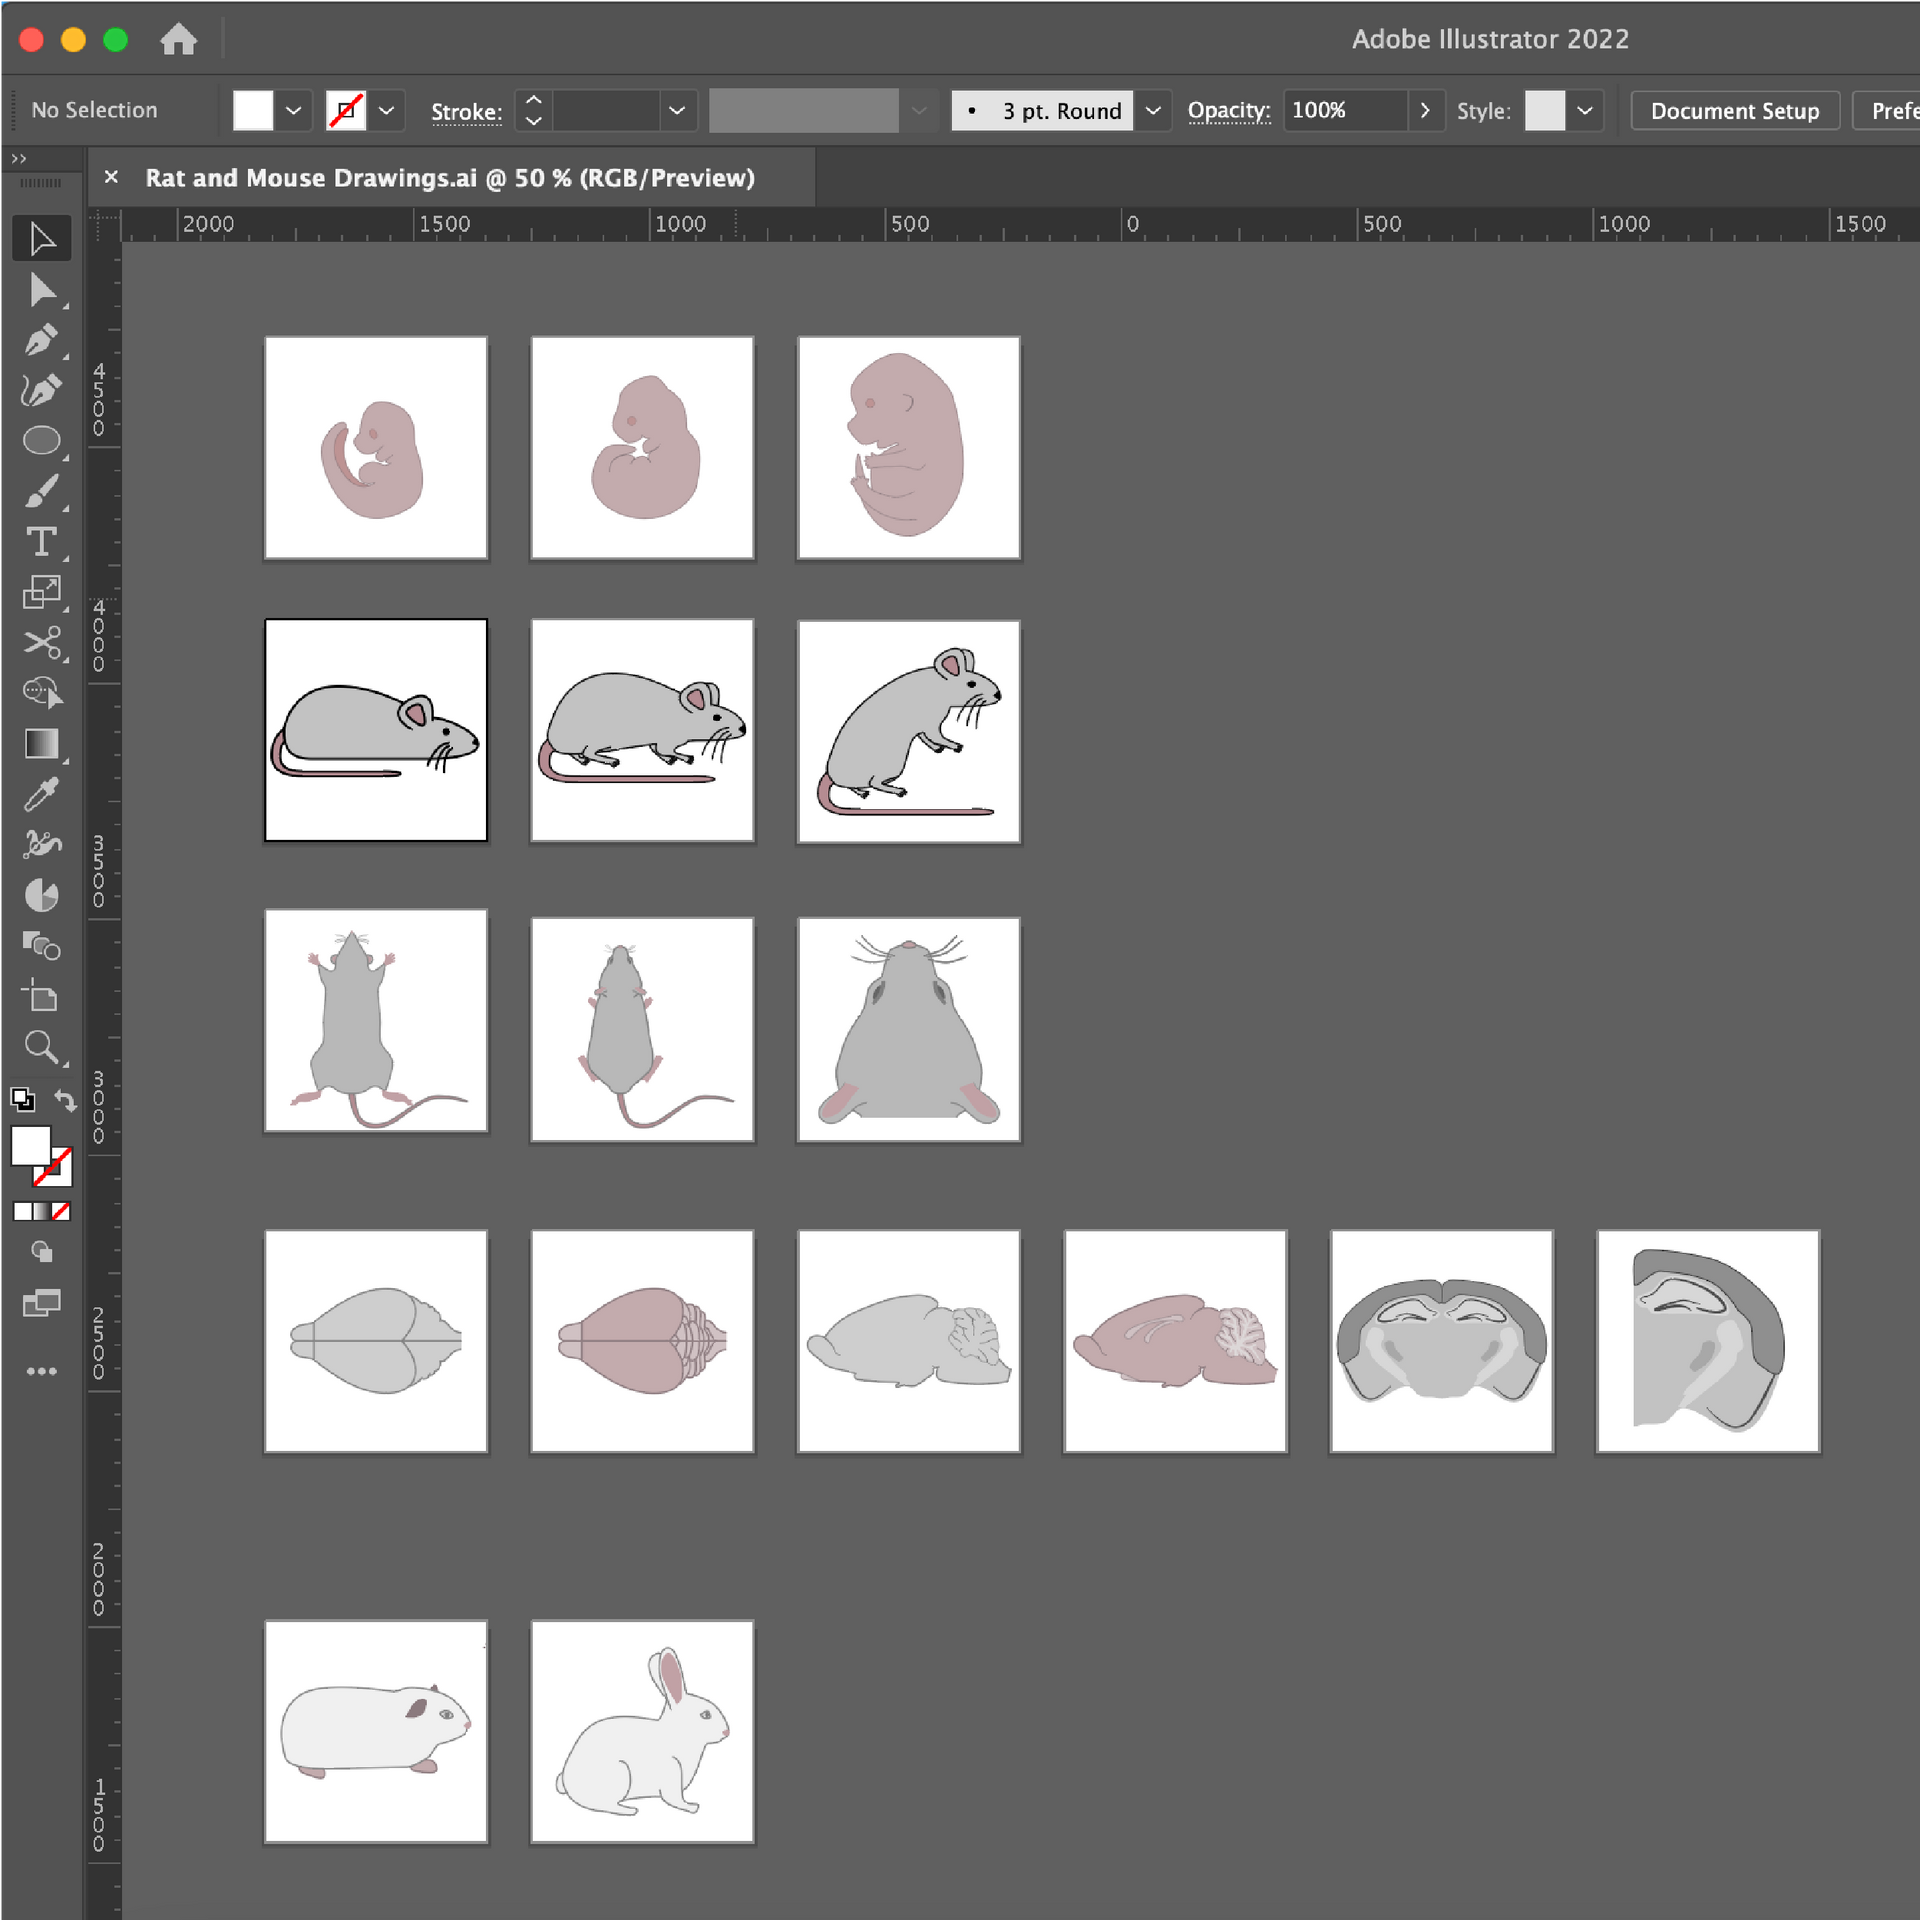
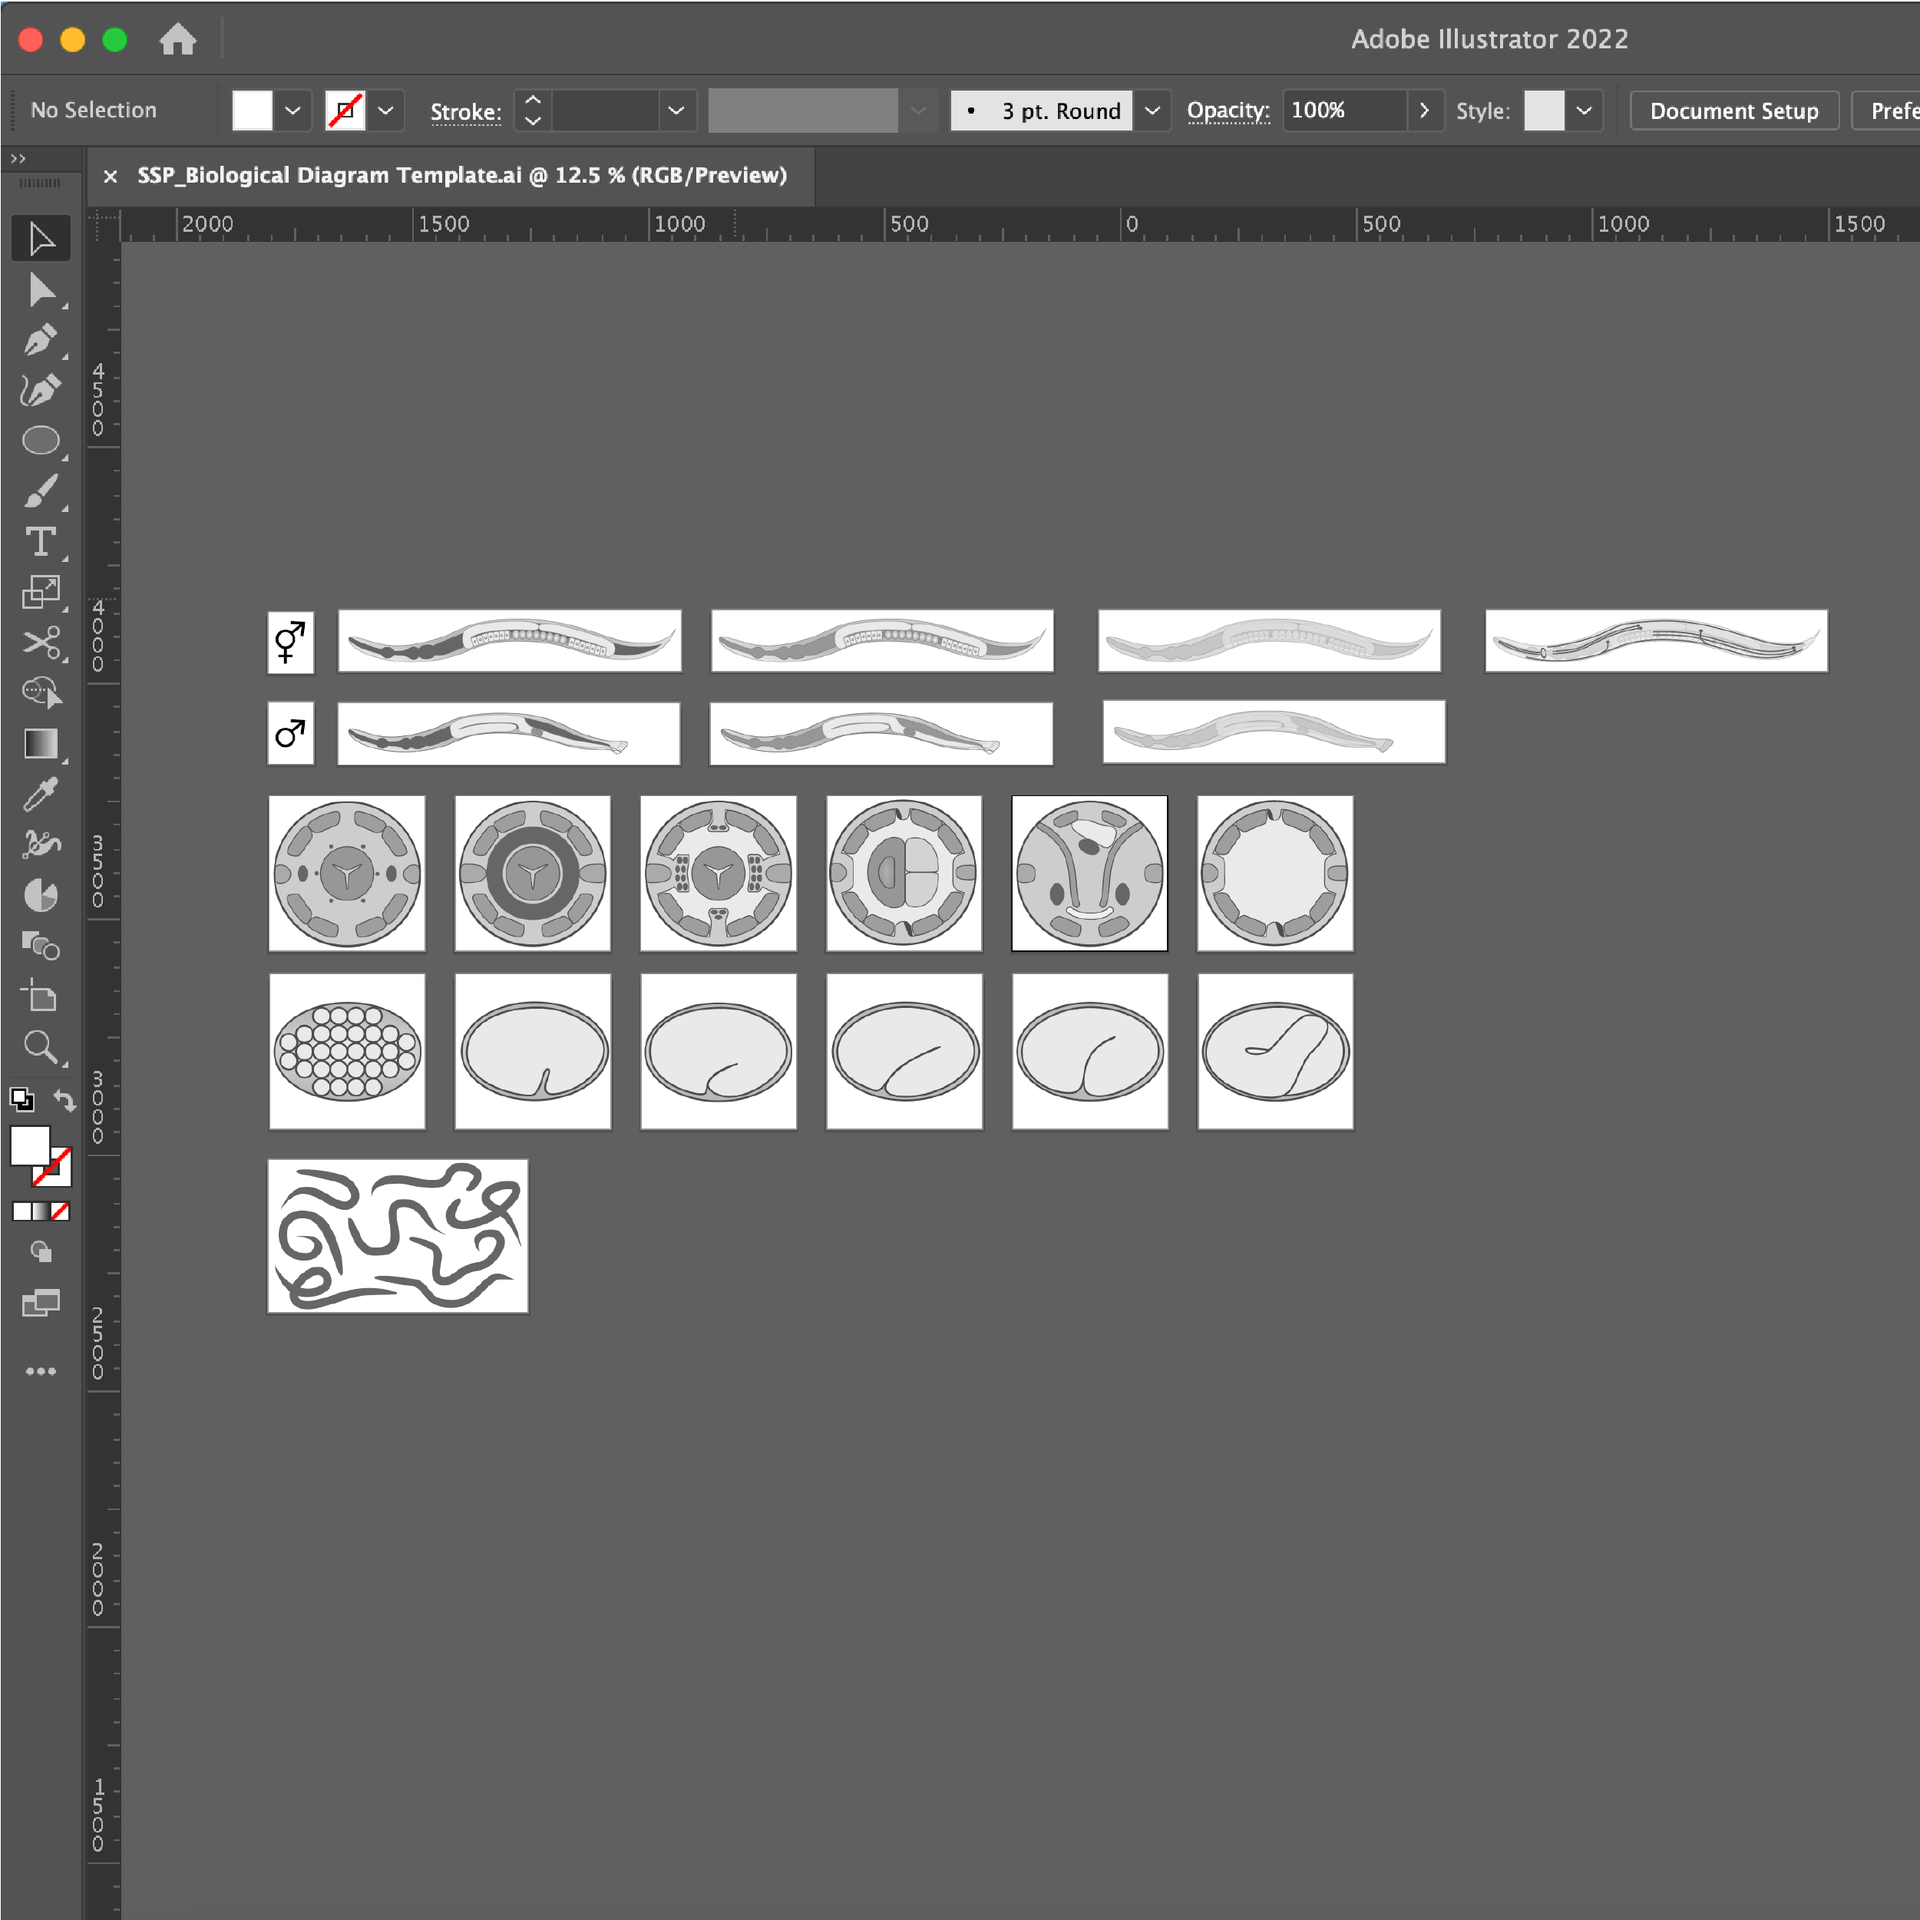
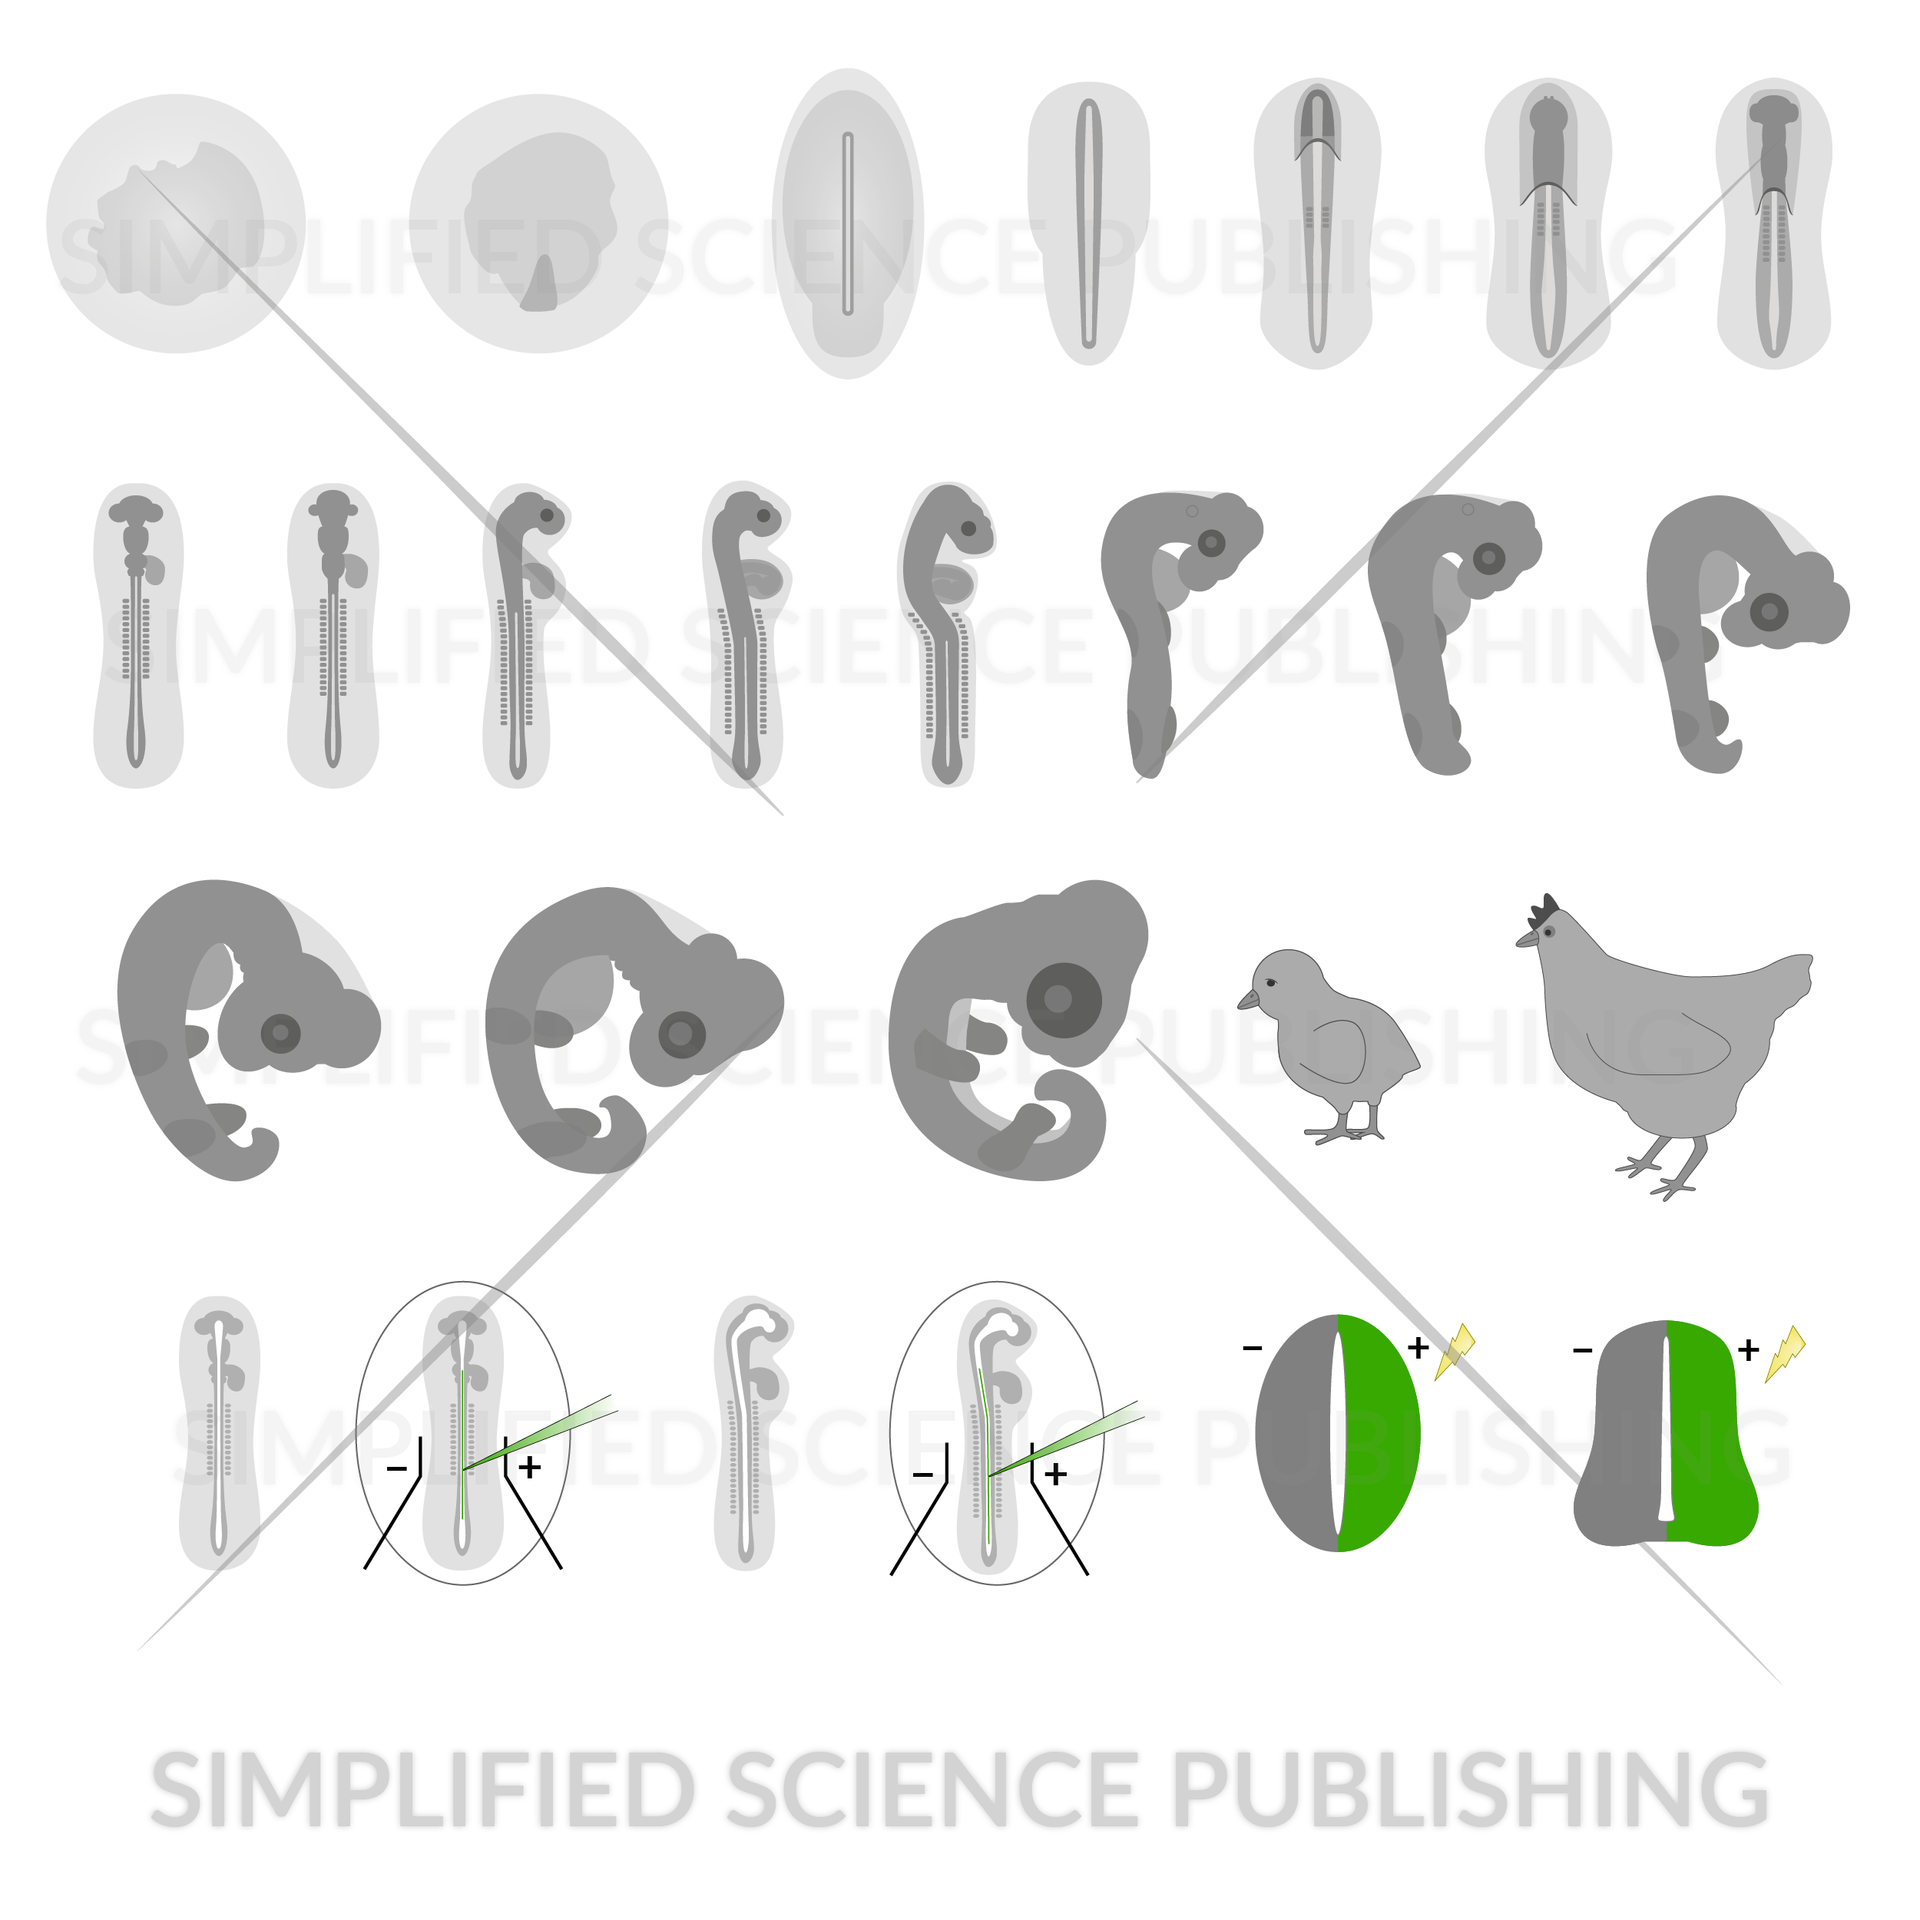
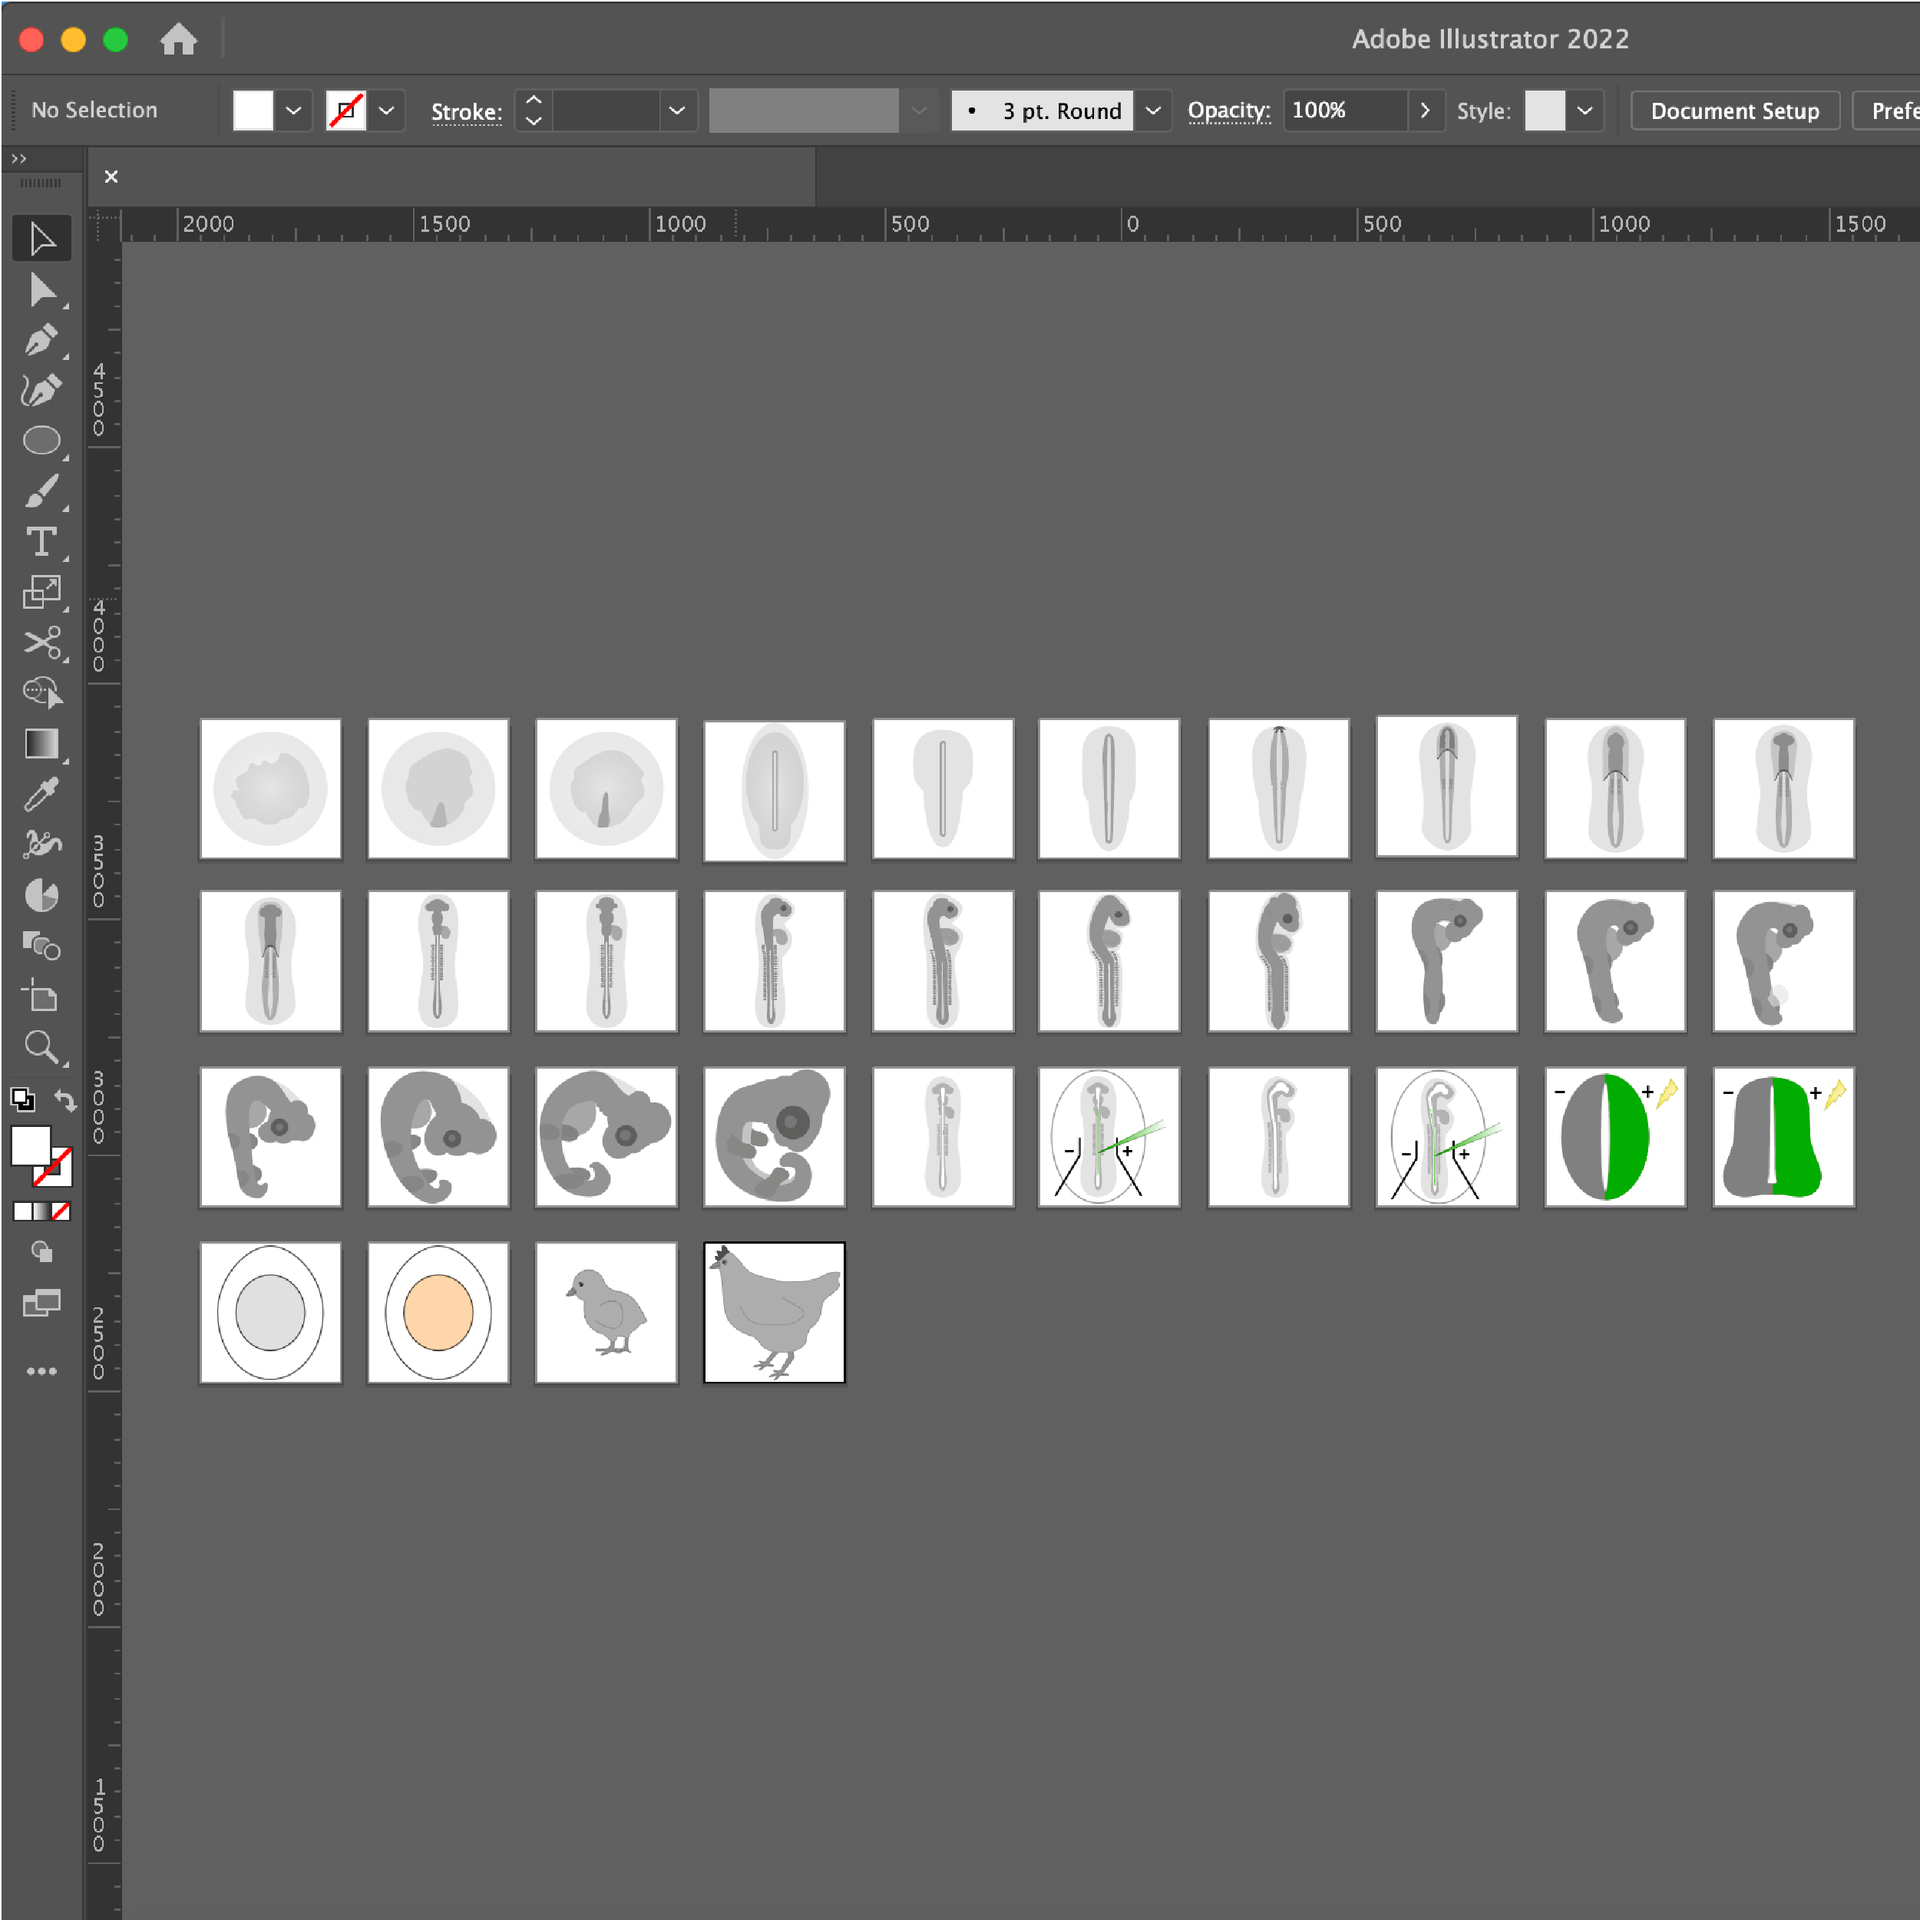
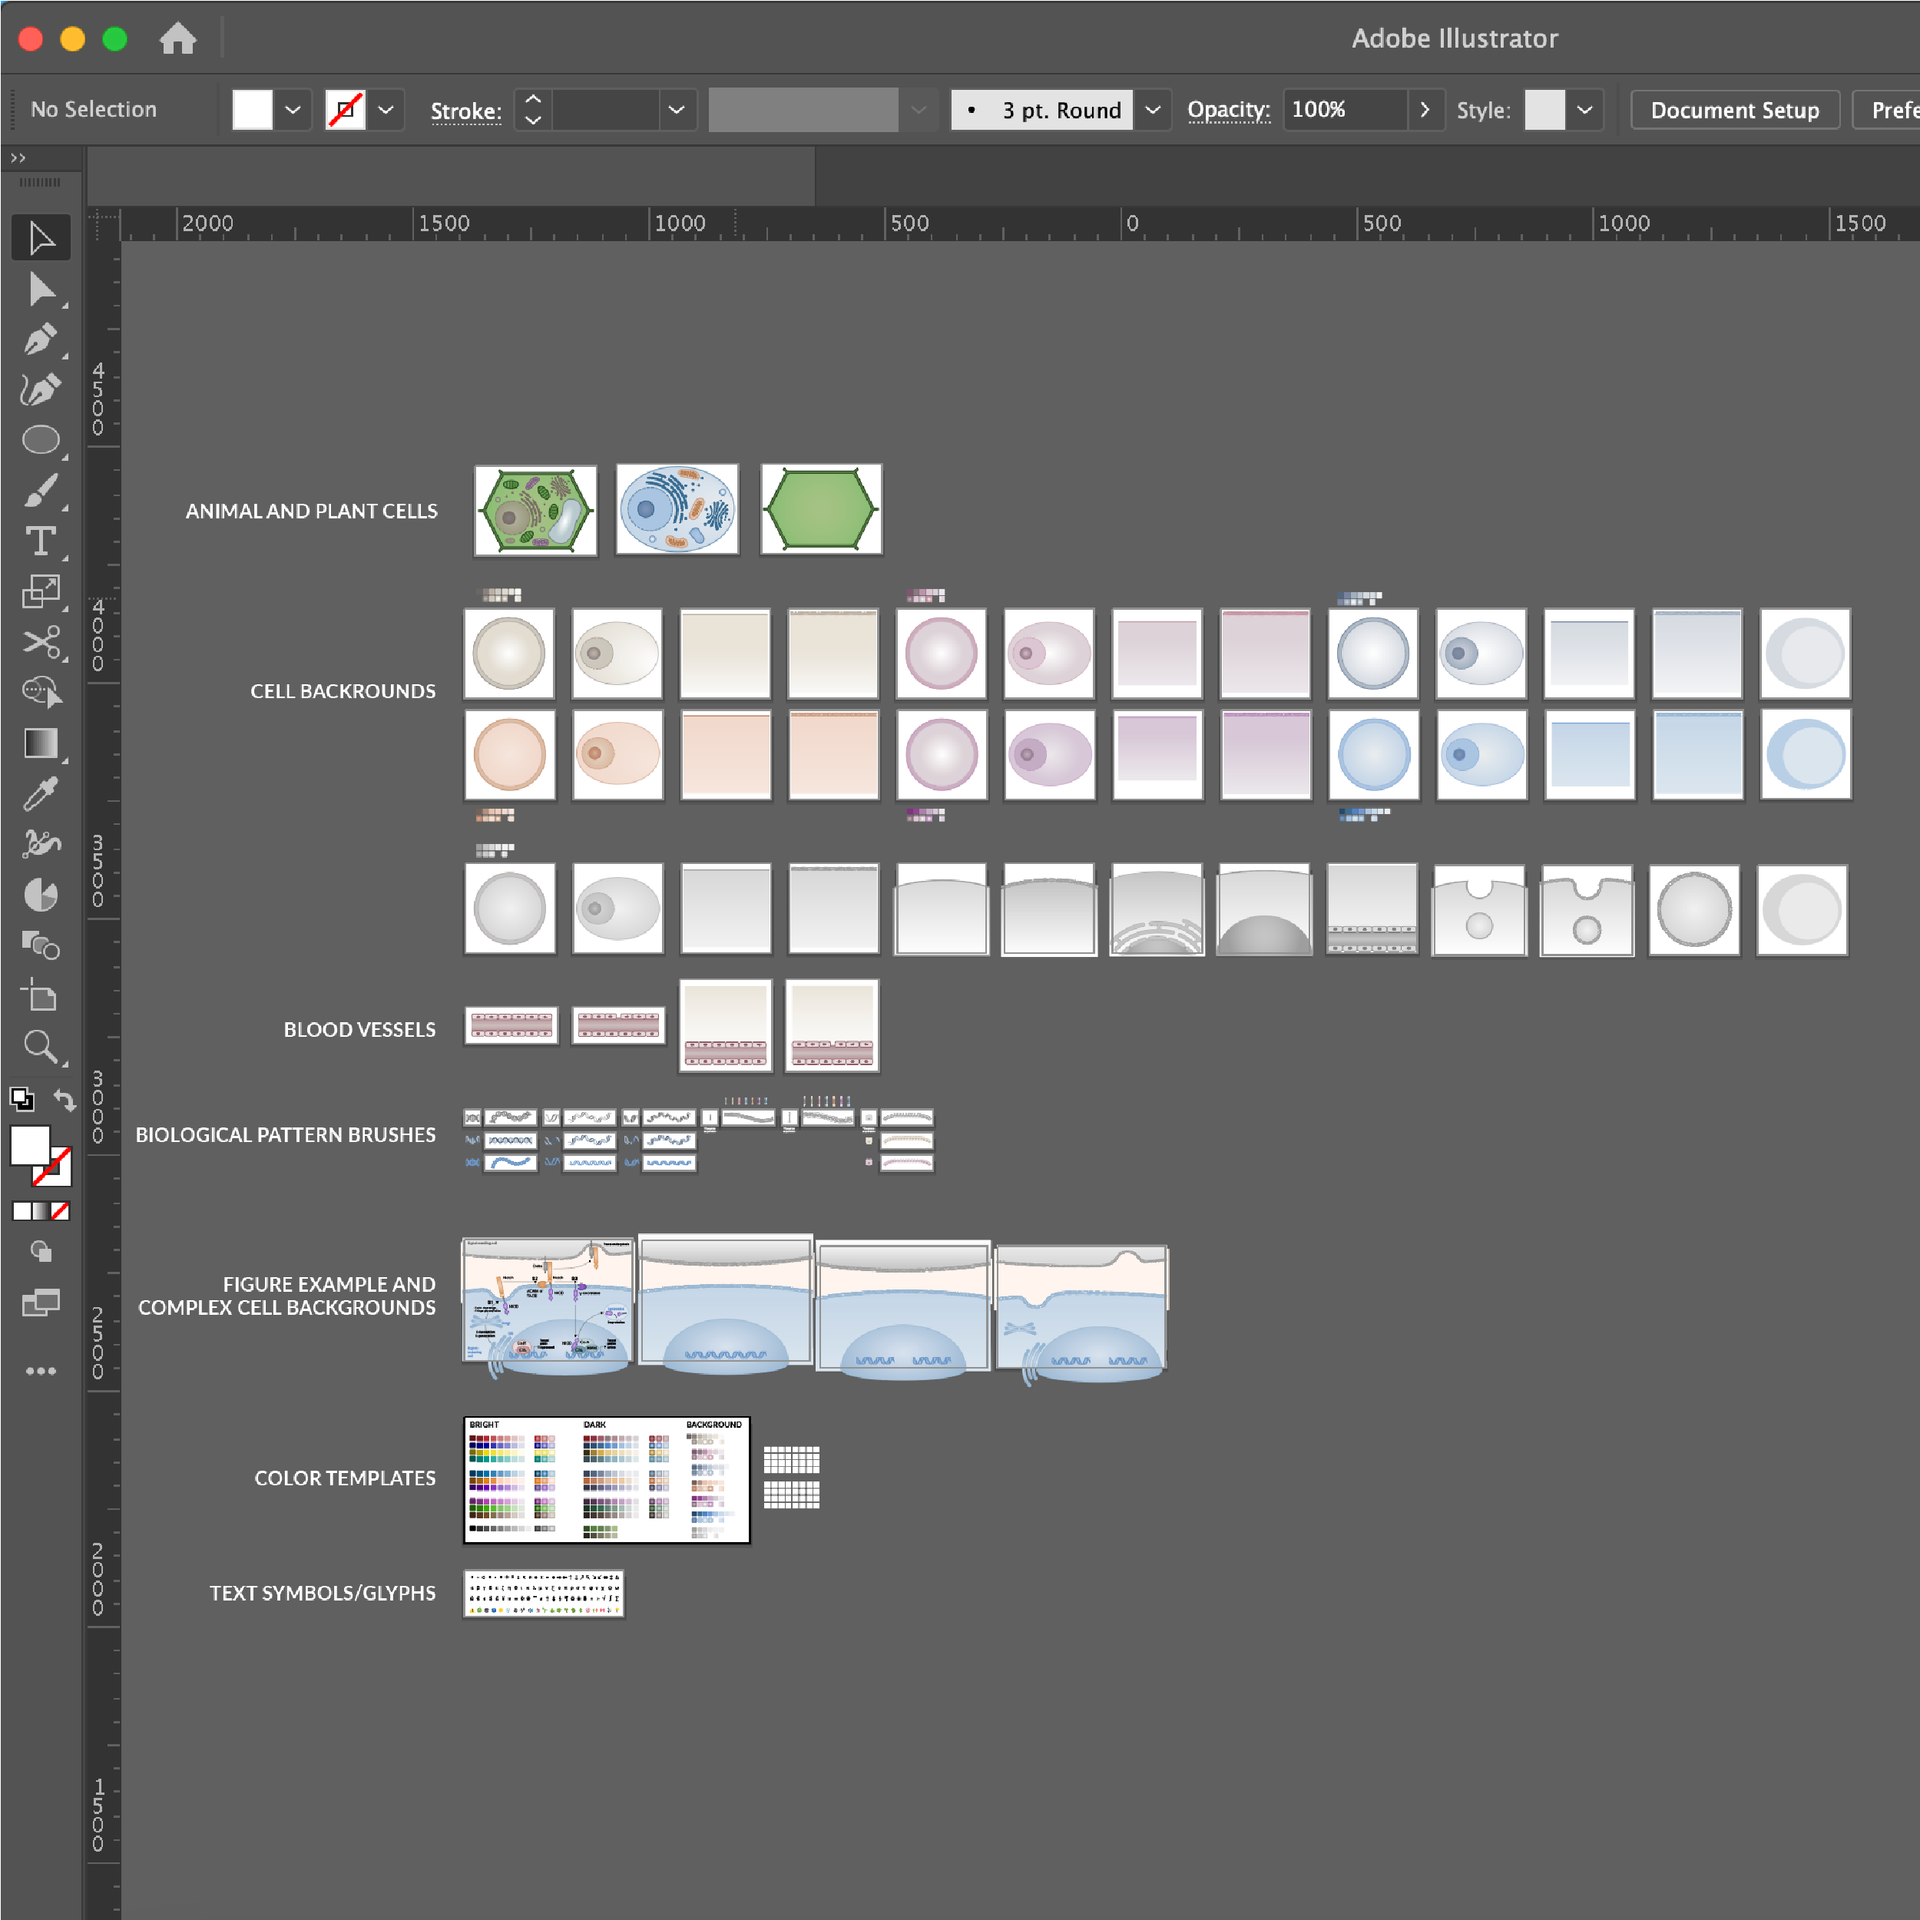
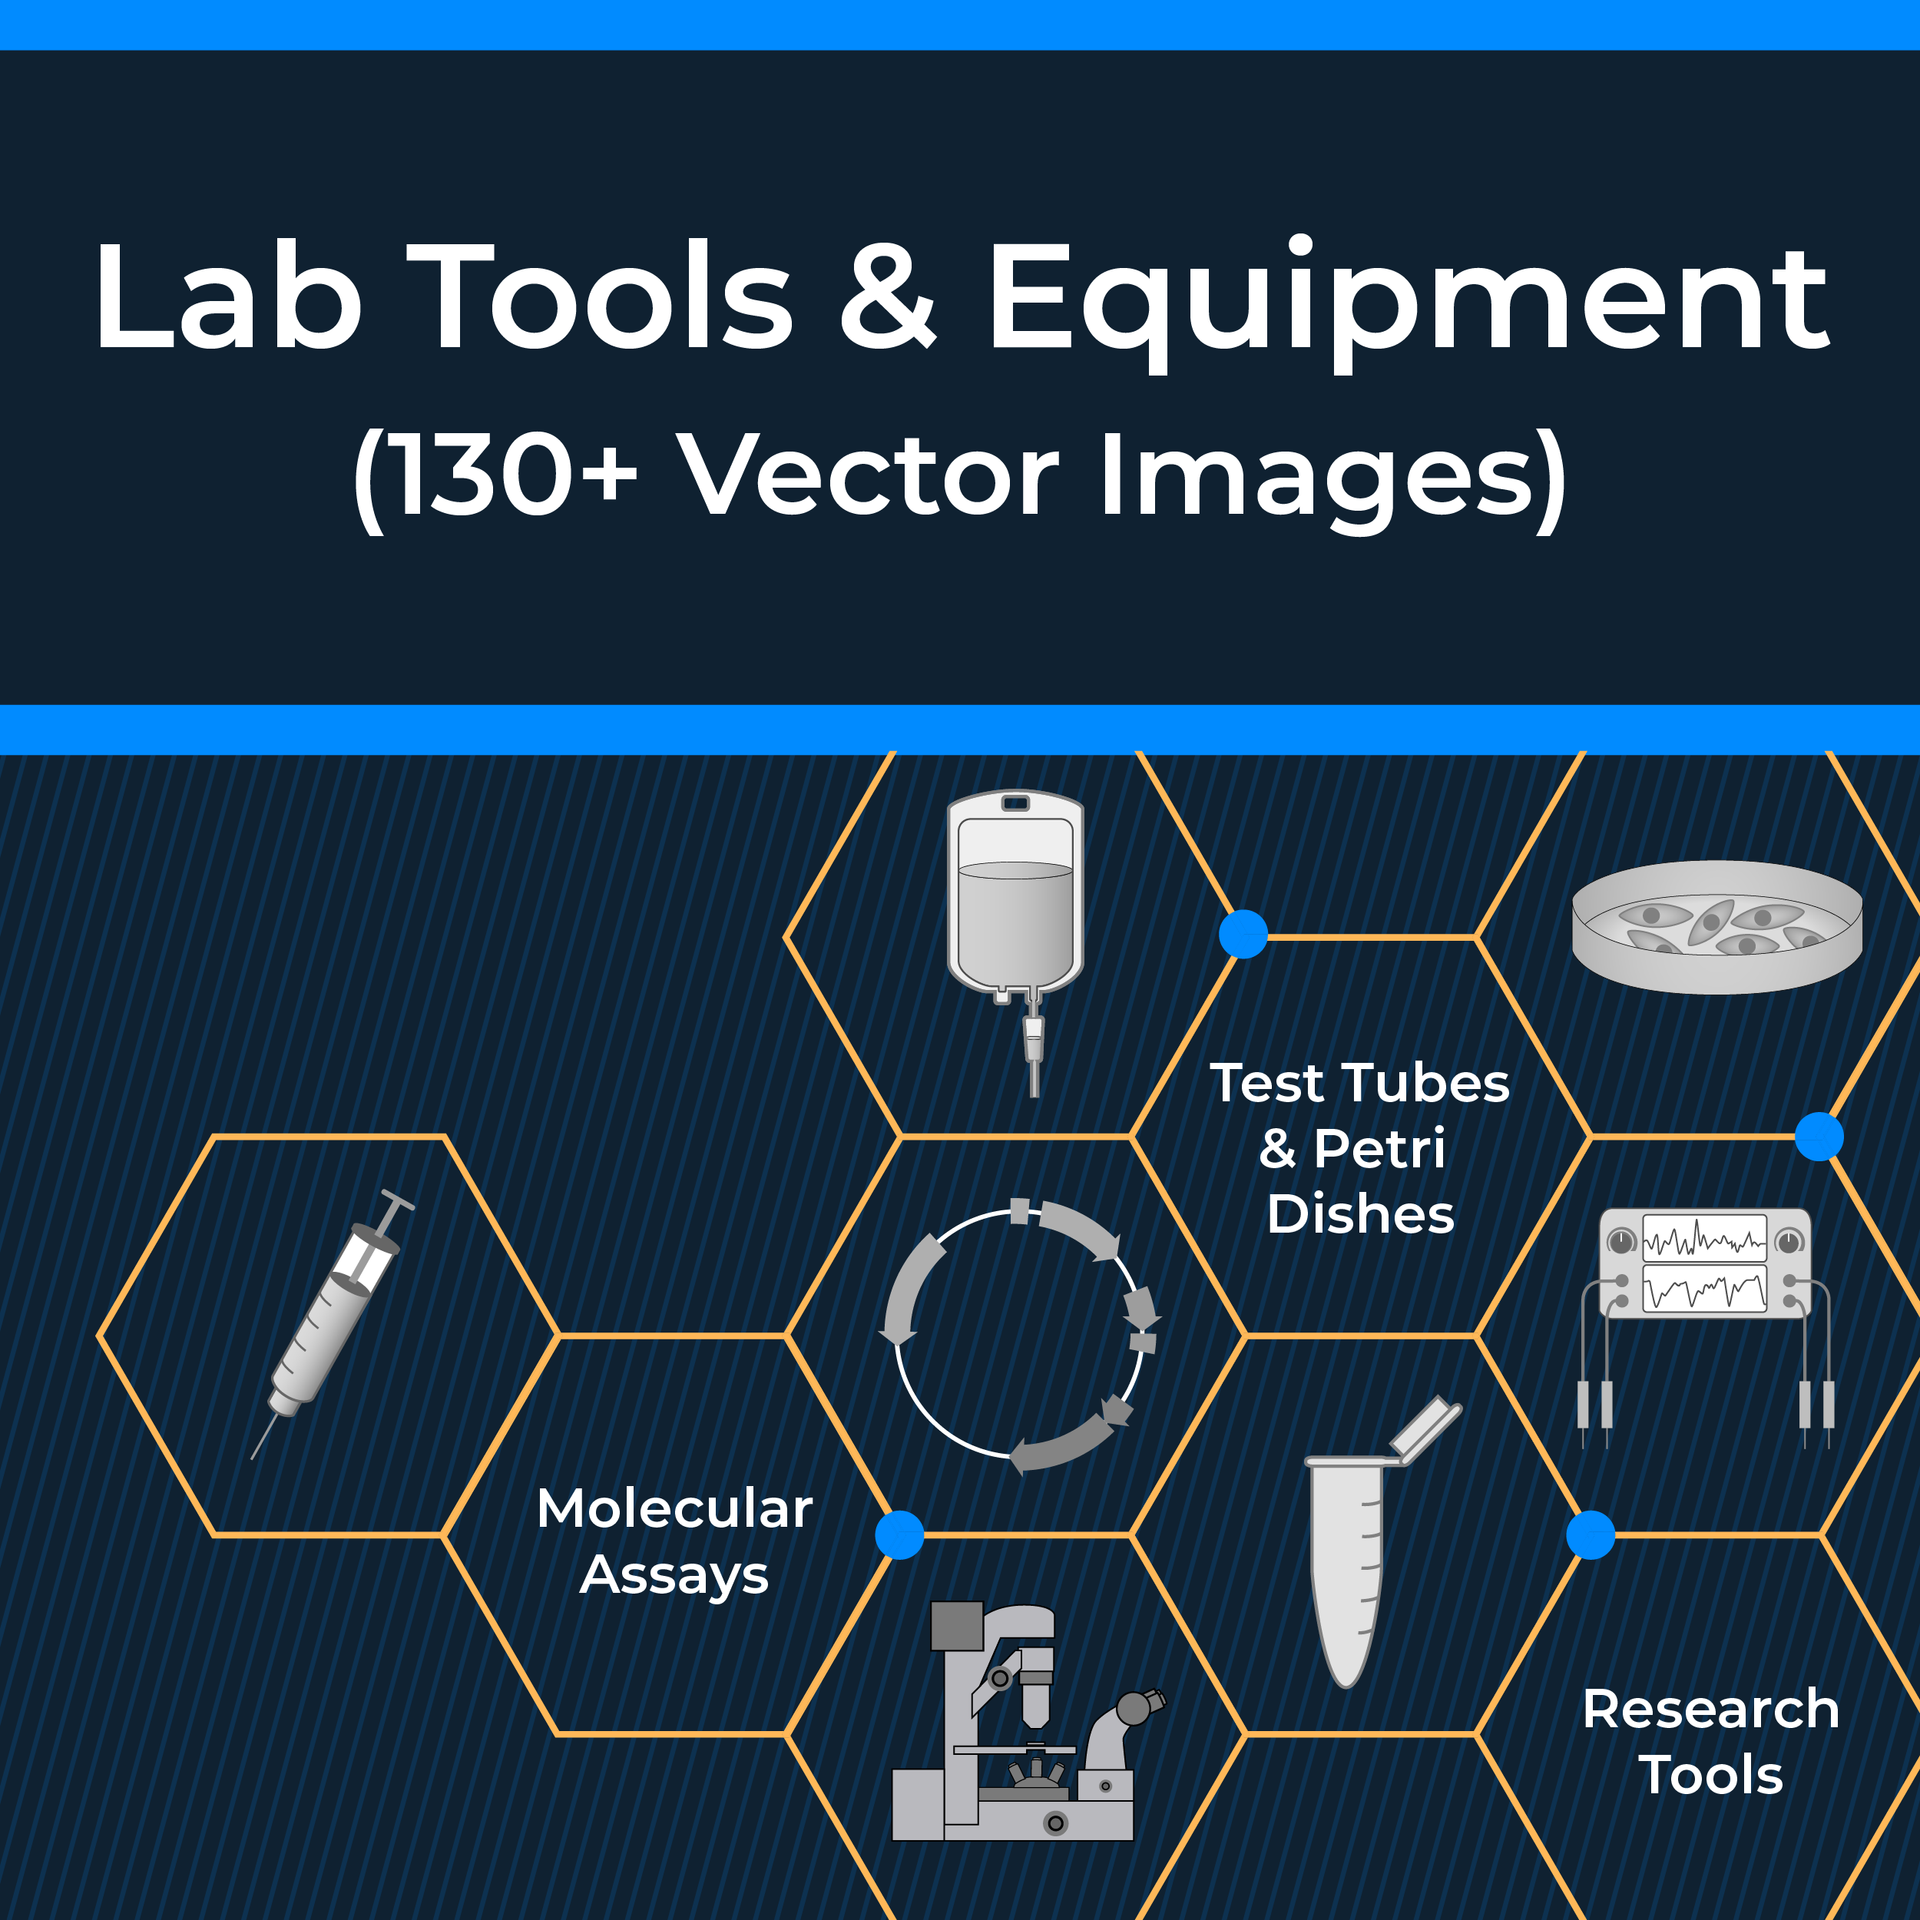
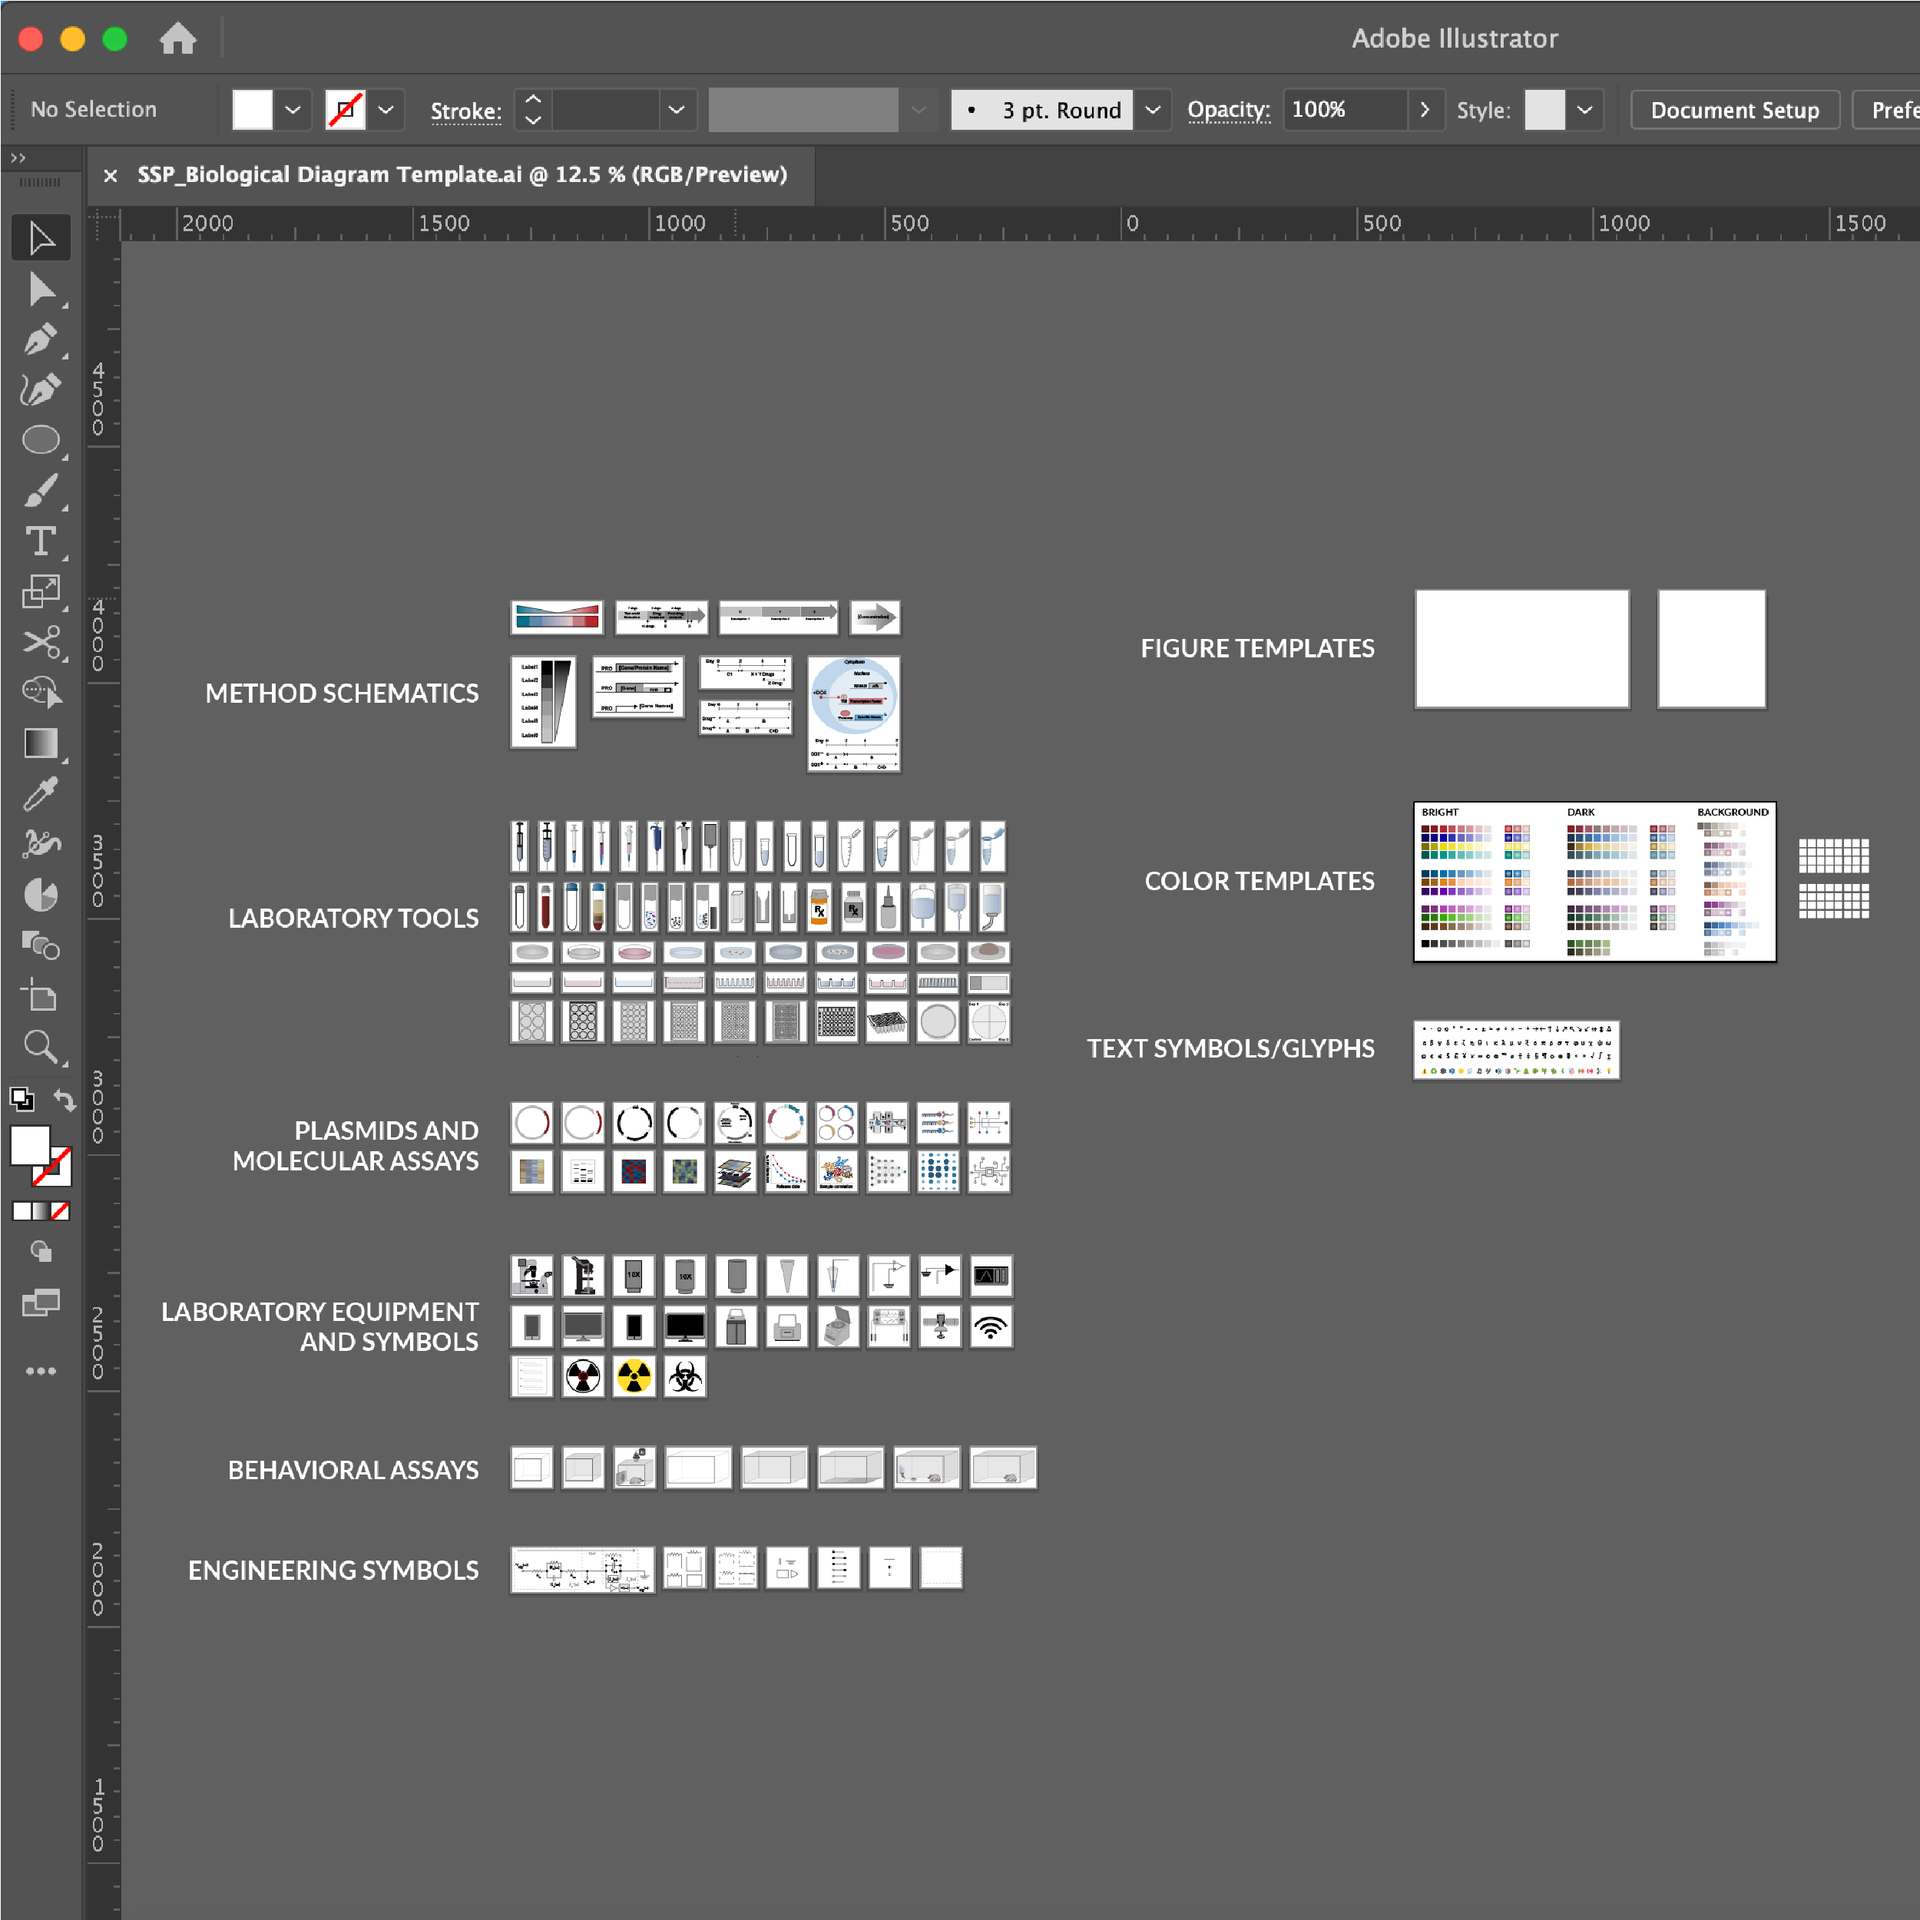
NOTE: These templates are included with Simplified Science Pro for $59. Pro users also receive the popular 270+ Biological Diagram and 130+ Laboratory Tool vector illustration templates, science figure and color palette templates, PowerPoint slides, and access to over 50 training videos.